Timisoara_Med 2020, 2020(1), 5; doi:10.35995/tmj20200105
Article
Parathyroid Elastography―Elastography Evaluation Algorithm
1
Department of Doctoral Studies, Victor Babeș University of Medicine and Pharmacy, 300041 Timișoara, Romania; cotoi.laura@umft.ro
2
Department of Endocrinology, Victor Babeș University of Medicine and Pharmacy, 300736 Timișoara, Romania; stoian.dana@umft.ro
3
2nd Department of Internal Medicine, Victor Babeș University of Medicine and Pharmacy, 300736 Timișoara, Romania; isporea@umft.ro (I.S.); schiller.adalbert@umft.ro (A.S.)
4
B Braun Avitum Dialysis Medical Center, 307350 Remetea Mare, Romania; oana.schiller@bbraun.com
5
Department of Mathematics and Biostatistics, Victor Babeș University of Medicine and Pharmacy, 300041 Timișoara, Romania; pop.nicusor@umft.ro
*
Correspondence: dana_amzar@yahoo.com (D.A.); borlea.andreea@umft.ro (A.B.); Tel.: +40-744690639 (D.A.); +40-743451118 (A.B.)
How to cite: Cotoi, L.; Amzăr, D.; Sporea, I.; Borlea, A.; Schiller, O.; Schiller, A.; Pop, G.N.; Stoian, D. Parathyroid Elastography—Elastography Evaluation Algorithm. Timisoara Med. 2020, 2020(1), 5; doi:10.35995/tmj20200105.
Received: 12 August 2020 / Accepted: 12 October 2020 / Published: 3 December 2020
Abstract
:(1) Background: Primary hyperparathyroidism is a common disorder of the parathyroid glands and the third most frequent endocrinopathy, especially among elderly women. Secondary hyperparathyroidism is a common complication of chronic kidney disease, associated with high cardiovascular morbidity and mortality. In both primary and secondary hyperparathyroidism, the need to correctly identify the parathyroid glands is mandatory for a better outcome. Elastography can be an effective tool in the diagnosis of parathyroid lesions, by differentiating possible parathyroid lesions from thyroid disease, cervical lymph nodes, and other anatomical structures. There are currently no guidelines or recommendations and no established values on the elasticity of parathyroid lesions. (2) Material and Methods: In our studies, we have evaluated, by Shear Wave elastography (SWE), both primary and secondary hyperparathyroidism, determining that parathyroid glands have a higher elasticity index than both thyroid tissue and muscle tissue. (3) Results: For primary hyperparathyroidism, we have determined, using 2D-SWE, the parathyroid adenoma tissue (mean elasticity index (EI) measured by SWE 4.74 ± 2.74 kPa) with the thyroid tissue (11.718 ± 4.206 kPa) and with the surrounding muscle tissue (16.362 ± 3.829 kPa). For secondary hyperparathyroidism, by SWE elastographic evaluation, we have found that the mean EI in the parathyroid gland was 7.83 kPa, a median value in the thyroid parenchyma of 13.76 kPa, and a mean muscle EI value at 15.78 kPa. (4) Conclusions: Elastography can be a useful tool in localizing parathyroid disease, whether primary or secondary, by correctly identifying the parathyroid tissue. We have determined that an EI below 7 kPa in SWE elastography correctly identifies parathyroid tissue in primary hyperparathyroidism, and that a cut-off value of 9.98 kPa can be used in 2D-SWE to accurately diagnose parathyroid disease in secondary hyperparathyroidism.
Keywords:
elastography; parathyroid; hyperparathyroidism; shear wave elastography; ultrasonography; parathyroid adenoma; ultrasonography; elastography; strain elastographyIntroduction
Hyperparathyroidism is characterized by the discharge of the parathyroid hormone (PTH). The disease can be categorized as primary, secondary, or tertiary [1,2]. Primary hyperparathyroidism (PHPT) is defined as the most frequent disease of the parathyroid glands and one of the most frequent endocrine disorders [3].
The most prevalent and recurring complication of end-stage renal disease is secondary hyperparathyroidism (sHPT). If present, it increases cardiovascular morbidity and mortality [4,5].
There is an increased incidence in Europe, with an incidence in Sweden of 3% of women and 0.7% of men over the age of 60, and an annual rate of 16 per 100,000 reported in Denmark [6,7].
The prevalence in Europe of renal sHPT is predicted at around 8.5% in the United Kingdom, 8.2% in France, and at a lower prevalence in Spain and Portugal (6.8% and 6.1%) [8].
The treatment options, depending on the type and severity of hyperparathyroidism, are as follows: follow up in cases with asymptomatic primary hyperparathyroidism; surgical treatment in symptomatic primary hyperparathyroidism; surgical treatment in upgraded asymptomatic primary hyperparathyroidism.
KDIGO guidelines recommend that, when serum PTH level is higher than 800 pg/mL and the patient presents hypercalcemia (calcium > 10.4 mg/dL) with hyperphosphatemia which is non-respondent to medical treatment, parathyroidectomy should be considered, especially in patients before renal transplantation [9,10]. Symptomatic patients are also candidates for parathyroidectomy [9].
When considering parathyroidectomy for treatment, a correct apperception of the location of the glands is compulsory.
Ultrasonography is the most sought for examination for thyroid disease because of its important role in the management and diagnosis of thyroid nodules [11].
Elastography is a somewhat novel technique that can be used to assess tissue stiffness with the potential of differentiating benign from malignant tissues [12,13].
Elastography has proved his usefulness in many areas of medicine and it has been recognized as a marker of pathological state [14]. By improving diagnostic methods and establishing its role in breast tumors characterization, thyroid nodules, testicular cancer, and liver pathology, studies can also be conducted on primary hyperparathyroidism [12,15,16,17,18,19,20,21].
Experimental Section
Greyscale Ultrasonography-Description and Method
Ultrasonography (US) has gained increasing accessibility in the endocrine field, becoming a gold standard in thyroid disease. The main advantages of US are the fact that it is a non-invasive method, it is cheap and repeatable, and it offers a real-time assessment of organs [22,23].
When applying US in the parathyroid field, the main utilization is for localizing parathyroid disease before surgery. Ultrasound parathyroid examination follows the same procedure as thyroid US evaluation. The examiner needs to maintain constant and precise adherence of the probe to the area of examination [22,24,25].
Ultrasound examination of parathyroid glands includes a large ultrasound window, in both longitudinal and transverse modes, from the carotid arteries to the hyoid bone and extending from the superior carotid artery bifurcation to the inferior thoracic inlet [25,26]. Auxiliary techniques, such as rotating the head or swallowing can enhance the visualization of ectopic parathyroid glands. The thyroid gland should be always evaluated for concomitant thyroid pathology or the presence of intrathyroidal parathyroid adenoma [26].
The sensitivity of ultrasound identification of parathyroid tumors varies from 70% to 80% with a much larger interval for parathyroid hyperplasia (30–90%), but precision is dependent on the region and size of the tumor, by body conformation and gland morphology, and also by the skill of the practitioner [24,27,28,29]. There are increased false-positive US results, because of structures mimicking parathyroid adenoma (thyroid nodules, lymph nodes, muscles, vessels, and esophagus) [29].
The diagnostic value of ultrasound for diagnosing hyperparathyroidism was acknowledged by using different applications of ultrasound, counting Doppler techniques, 3D imaging, contrast-enhanced ultrasonography, and elastography techniques [22].
Adding Color Doppler Mode
Color Doppler sonography can be used as a complementary technique for the localization of parathyroid disease, especially parathyroid adenomas [30]. Parathyroid adenomas often present a peripheral vascular rim and an abnormally marked vascularization compared to the thyroid gland [31]. Therefore, using Doppler imaging can help increase the accuracy and sensitivity of ultrasound by 54% and 10%, respectively [32].
Ultrasound Elastography—Description and Method
Elastography can be a helpful technique for evaluating parathyroid disease. It may be used with other complementary techniques of ultrasonography, adding additional information on tissue stiffness.
Changes in tissue stiffness can be found in neoplastic tissues, fibrous tissues, or in atherosclerotic plaques [12]. Early stages in the tissue matrix can lead to early diagnosis of neoplastic development, due to the overproduction of connective tissue, increased blood vessel density, and changes in the cell density [33]. Elastography can detect the differences between benign and malignant tissues from early stages of the disease [13].
Elastography can determine tissue stiffness by applying an external stress, determining the distortion degree [34]. The distortion in elastography can be obtained by external pressure, usually applied manually via an ultrasound transducer, or by internal crossing deformation; acoustic radiation force impulse (ARFI) is induced by converged ultrasound beams or by emitting a short duration focused acoustic beam that will generate shear waves that diffuse transversally through the tissue [34].
Elastography offers qualitative information about tissue stiffness through color maps and color codes and quantitative information through numerical values [12].
Shear Wave Elastography (SWE)
By using SWE elastography, tissue rigidity is evaluated by using the shear wave attenuation technique.
By using a focused ultrasound beam, vibrations are induced by acoustic radiation force, thus making this method more operator independent [12,35,36]. The induced vibrations are analyzed by the machine and quantitative data are displayed, showing the tissue elasticity [35].
Quantitative data, depending on the ultrasound machine used, can be measured with wave velocity in m/s or by direct measurement in the region of interest (ROI) in kilopascals—kPa. Color maps are displayed—soft tissues are blue and stiff tissues are red—offering qualitative data about the tissue stiffness [12,37].
Material and Methods
This prospective study has the objective to determine, by using elastographic methods, the SWE characteristics of parathyroid adenoma and hyperplastic parathyroid glands from secondary hyperparathyroidism and to conclude if the technique adds novelties for the preoperative diagnostic.
The first group, evaluated from November 2018 to June 2019, contained 20 patients diagnosed with primary hyperparathyroidism. The diagnosis was confirmed by serum evaluation, identification with Technetium Sestamibi scintigraphy (MIBI), and confirmed by a pathology report after parathyroidectomy. All patients were adults with solitary parathyroid adenoma; ectopic adenomas were omitted.
The second group, evaluated in the B Braun Dialysis Center, included 120 patients, all adults known with stage 5 CKD, under hemodialysis; the hemodialysis regimen was 3 times a week. Out of the one hundred and twenty evaluated patients, fifty-nine patients had parathyroid disorders, confirmed secondary hyperparathyroidism by clinical, biological evaluation, and scan—scintigraphy or MRI for more than six months before the ultrasound examination.
We also considered patients with antecedents of subtotal parathyroidectomy, whom at the moment presented other parathyroid glands enlargement on ultrasound. The final analysis included all the identified glands, even if one or more parathyroid glands were visible in each patient.
Excluded from the analysis were ectopic parathyroid glands and cases with secondary adynamic bone disease, or secondary hyperparathyroidism who underwent total parathyroidectomy.
The studies were approved by the Ethics Committee and all patients signed written consent. The study followed the Ethics Code of the World Medical Association.
Conventional Ultrasound
Parathyroid ultrasound evaluation was first made by conventional B-mode with Aixplorer Mach 30 machine (SuperSonic Imagine, France). The linear, high-resolution transducer of 15–4 and 18–5 MHz was chosen because of the clarity of the image. The patient remained resting in a supine position with regular breathing.
Using greyscale US, we evaluated the following parameters: parathyroid (when found volume, shape, dimensions and echogenicity. Doppler US was used to observe the presence of a vascular rim of the parathyroid glands. Ultrasound evaluation was performed by two practitioners, one having extensive experience on neck ultrasound.
Elastography evaluation—SWE
Using the same machine, Aixplorer system (SuperSonic Imagine, France), and without moving the patients, after conventional B-mode US, SWE elastography measurement were performed. The chosen transducer was a high-resolution multifrequency linear transducer of 15–4 or 18–5 MHz, depending on the case, in order to get the best image.
Patients maintained their supine position, with neck hyperextension, as the examiner continued precise adherence of the probe to the investigated area, without applying any manual compression. Using induced vibrations by acoustic radiation force emitted by the transducer in the tissue and avoiding movements while abiding for image stabilization, elastographic data were obtained.
Real-time elastograms obtained offered a qualitative assessment of the tissue, while quantitative data were obtained by using the ultrasound machine software.
Evaluated quantitative parameters, described as the Elasticity Index (EI) are obtained within a region of interest (ROI). Before performing elastographic measurements, the elastography scale has to be fixed. As there are no established setting for parathyroid measurement in 2D-SWE, we have decided to use thyroid range settings between 0-100 kPa.
The EI measured on the Aixplorer system using the region of interest, identified as a Quantification Box (Q-Box) on this machine (Figure 1 and Figure 2). Q-Box appears only on the frozen image and determines quantitative information about tissue stiffness. Qualitative parameters, such as mean stiffness value (SWE-mean), maximum stiffness value (SWE-max), minimum stiffness value (SWE-min), standard deviation (SWE-SD), are displayed using machine software [38].
Statistical Analysis
Statistical analysis was performed using SPSS v.25 (Statistical Package for the Social Sciences, Chicago, IL, USA). Data were gathered and evaluated as continuous variables were bestowed as mean and standard deviation (SD) and categorical variables were given as frequency and percentages.
We completed descriptive and inferential statistical analysis to summate the characteristics of the study population. Standard deviation and mean were presented as continuous variables and frequency and percentages as categorical variables. Bias-corrected and accelerated bootstrap interval (1000 bootstrap samples) was used to calculate the 95% confidence interval limits. Descriptive and inferential statistics analysis was used to outline the characteristics of the study population. The results of the Shapiro–Wilk normality test showed a Gaussian allocation.
We analyzed the strength of a linear relationship between the elastographic measures obtained using SWE and therefore, the baseline values using Pearson correlation, in order to highlight parathyroid elasticity. To analyze patients’ characteristics in Table 1, we used a T test. For analyzing the SWE values of parathyroid and thyroid, we ran the ANOVA test, ensued by a post hoc analysis with Tukey’s test.
The Receiver Operating Characteristic (ROC) curve was engaged to demonstrate the diagnostic capacity and the thresholds to differentiate between the parathyroid and other tissues (thyroid, muscle) were determined with Youden’s index.
A p-value of <0.05 was considered to indicate a statistically significant difference.
Results
Twenty patients with primary hyperparathyroidism were studied (male to female ratio 1/19), mean age 57.3 ± 13.33, mostly postmenopausal women, and 59 patients (male to female ratio 27/32), mean age 56.95 ± 10.92, mostly above 65 years old, with confirmed CKD stage 5, on hemodialysis. Conventional ultrasound examination and 2D-SWE elastography were completed, as the results and baseline characteristics are described in Table 1.
A total number of 20 parathyroid adenomas (first lot) and 97 hyperplastic parathyroid glands (second lot) were studied.
For each parathyroid gland studied, 5 measurements were performed. We have also made the same measurements for normal thyroid tissue and muscle tissue, in order to compare them with the parathyroid tissue. Described in Table 2 are the SWE results, taking into consideration the following parameters: minimum SWE; maximum SWE; and the mean SWE for parathyroid, thyroid and muscle tissue.
In the first lot, for the parathyroid adenomas, a one-way ANOVA test demonstrated a statistically significant difference when measured by 2D-SWE, between parathyroid elasticity (kPa) compared with thyroid and muscle elasticity (p < 0.001) (Figure 3).
A significance level at p < 0.008, with higher parathyroid adenoma elasticity (4.74 ± 2.745 kPa) compared with normal thyroid tissue (11.718 ± 4.206 kPa), respectively, surrounding muscles (16.362 ± 3.829 kPa) was determined using post hoc analysis with the T test and a Bonferroni correction applied. The difference is important when comparing SWE mean values of parathyroid adenomatous tissue with thyroid parenchyma (mean difference = −6.978 kPa, p < 0.001), respectively, with mean SWE muscle values (mean difference = 11.622, p < 0.001) [39].
As for the quantitative measurements obtained, we have calculated using AUROC curve, sensitivity, specificity, accuracy and cut-off values for the measured parameters, as presented in Table 3. After analysis, we established that the preferred accuracy is by analyzing the mean SWE value, with a value of 92.5% for the parathyroid/thyroid couple and 97.5% for the parathyroid/muscle couple, followed by the min SWE value with an accuracy of 90.0% and 97.5%, respectively. Taking these data into account, whenever borderline values are found, Min SWE and max SWE values could be useful tools by helping to discriminate structures and positively identify parathyroid adenomas [40].
Using ANOVA test and post hoc analysis with Tukey’s test, we have found that for the secondary hyperparathyroidism lot, statistically significant difference for the mean SWE parathyroid values, compared with thyroid SWE (−5.945, p < 0.001) and with muscle (−7.953, p < 0.001) (Figure 4) [39].
The discerning power of elastography US examination was assessed using the Receiver Operating Characteristic Curve (ROC), comparing the mean SWE value of the parathyroid tissue with the mean SWE of the surrounding muscle. The Area Under Curve (AUC) was 0.949, 95% CI (0.917; 0.980). In conclusion, a value less than 9.98 kPa has a specificity of 90.7%, sensitivity of 93.8%, and accuracy of 91.75%, in identifying parathyroid adenoma using muscle as a reference (Figure 5) [38].
The ROC curve evaluated the SWE mean values for parathyroid tissue in relation to SWE mean values for thyroid tissue, with an AUC of 0.940 with 95% CI (0.903; 0.978) (Figure 6). Lastly, a value less than 9.74 kPa has a specificity of 90.7%, sensitivity of 94.8%, and accuracy of 92.26%, in differentiating parathyroid tissue, about thyroid tissue [39].
To resume, we have elaborated an algorithm for the evaluation of patients with suggestive symptoms or asymptomatic of primary or secondary hyperparathyroidism and how to use elastography to improve diagnostic accuracy (Figure 7).
Discussion
The study point of this article was to evaluate and compare the determined tissue elasticity index of parathyroid adenomas from PHPT and parathyroid hyperplasia from sHPT by using shear wave elastography. The elastographic values of the parathyroid adenoma and parathyroid hyperplasia were then compared to the elastographic features of the surrounding thyroid and sternocleidomastoid muscle. For the primary hyperparathyroidism lot, we had confirmation by biological evaluation, identification by Technetium Sestamibi scintigraphy (MIBI), and certification by morphopathology report after parathyroidectomy. For the secondary hyperparathyroidism lot, we included hyperplastic parathyroid glands that were initially localized in conventional B-mode ultrasonography and confirmed using parathyroid Technetium Sestamibi scintigraphy.
Elastography is a novel ultrasound technique for the parathyroid field, as there are no international guidelines for primary or secondary hyperparathyroidism. There is no “when and why” for parathyroid ultrasound in the management of primary or secondary hyperparathyroidism.
Elastography is gaining ground in the parathyroid exploration, as there are several studies in the literature on primary hyperparathyroidism, demonstrating the usefulness of this technique [40].
By studying parathyroid elastography, we concluded that tissue stiffness of parathyroid adenoma is best assessed by using mean SWE, correctly identifying parathyroid tissue. A mean (±SD) SWE value of 4.74 ± 2.745 kPa was found for all parathyroid adenomas enrolled in the study. When we compared the mean SWE values of thyroid tissue (mean SWE value 11.718 ± 4.206 kPa) and surrounding muscle tissue (mean SWE value 16.362 ± 3.829 kPa), we found that the elasticity of parathyroid adenoma was significantly lower than them both. For this lot, we have constituted that the most reliable index is mean SWE, with a cut-off value for correctly identify parathyroid adenomas below 7 kPa.
Elastographic measurements of parathyroid hyperplasia for secondary hyperparathyroidism could be useful in diagnosing and treating parathyroid hyperplasia and preventing tertiary hyperparathyroidism. The mean SWE value found for hyperplastic parathyroid glands enrolled in the study was 7.83 ± 2.94 kPa. By comparing the mean SWE values of parathyroid tissue with the values obtained for thyroid tissue (13.780 ± 4.039 kPa) and surrounding muscle (15.788 ± 4.409 kPa), we established that parathyroid elasticity is significantly lower than both thyroid and muscle tissue. A cut-off value of below 9.74 kPa presented a sensitivity and specificity of 94% and 90%, respectively, for identifying parathyroid tissue in comparison with thyroid tissue. If compared with muscle tissue, a value of below 9.98 kPa had a specificity and sensitivity of 90% and 93%, respectively, for identifying parathyroid tissue in comparison with muscle tissue.
There are literature studies that have determined thresholds for parathyroid elastography, using different elastographic measurements: using the SWE VTIQ method, the mean SWV of parathyroid adenomas (2.16 ± 0.33 m/s) was higher than the mean SWV of parathyroid hyperplasia (1.75 ± 0.28 m/s), with a cut-off value greater than 1.92 m/s for diagnosing parathyroid adenoma [23,39].
Studies in the literature on parathyroid adenomas, conducted using SWE VTIQ, concluded that parathyroid adenomas have a lower mean value, determined at 2.01 m/s (±0.24) compared with the normal thyroid tissue—2.77 m/s [19]. By using ARFI imaging, 2D-SWE parathyroid adenomas (mean SWV value of 3.09 ± 0.75 m/s) present lower elasticity than benign thyroid nodules (2.20 ± 0.39 m/s) and a higher elasticity compared to malignant thyroid lesions (3.59 ± 0.43 m/s) [41].
Another study conducted on 2D-SWE for parathyroid adenomas found a mean SWE value of 5.2 ± 7.2 kPa, significantly lower than thyroid nodules—24.3 ± 33.8 kPa—thus, concluding that parathyroid adenomas have lower elasticity index than benign thyroid tissue [42].
We did take into account thyroid disease and the presence of thyroid nodules, but the details are present in the dedicated article [39].
There are several literature studies that have documented elastographic assessments on parathyroid hyperplasia. Nonetheless, they were not done on patients with end-stage renal disease on hemodialysis therapy.
Multiple cut-off values were given in the literature for parathyroid hyperplasia. If determined on shear wave elastography, 1.46 m/s [20]; if determined using Elastoscan Score Index, 1.35 ± 0.61 [43]. However, we have to keep in mind that they were made on parathyroid hyperplasia from chronic kidney disease and not on patients with ESRD under RRT therapy.
The biological data gathered corroborate the observation of an important interrelationship between SWE parathyroid values and PTH values. We could not determine any correlation between parathyroid volume and SWE values, but we note that tissue elasticity does not depend on size or volume.
By elastographic evaluation, we determine tissue strain, or the difference between echo time delays achieved cross-correlating echo signals before and after tissue distortion. By keeping this in mind, we have to consider that, in parathyroid hyperplasia, the presence of chief cells dominant in the cell population in early phases of the disease and oncocytes in the advanced cases may contribute to the elastography measurement, making it dependent on the cell occupancy rate and with the phases of the disease.
There were limitations on both studied lots; firstly, the small number of patients with primary hyperparathyroidism, with an upside of the histopathological exams of the parathyroid lesions.
The main limitation for the secondary hyperparathyroidism lot was the lack of morphopathological exams in all patients, as not all patients were immediately referred to surgery. Nevertheless, the presence of parathyroid gland enlargement was certified both by ultrasonography and parathyroid scintigraphy.
After comparing the two lots of patients with primary and secondary hyperparathyroidism, we can conclude that regardless of parathyroid adenoma or parathyroid hyperplasia, on elastography, it will have a lower EI than both thyroid tissue and muscle tissue.
Parathyroid adenoma apparently presents a lower elastographic elasticity index than parathyroid hyperplasia present in renal secondary hyperparathyroidism, probably due to the cell occupancy rate and alterations due to the renal disease. However, in both cases, the EI will be lower than the thyroid elasticity index and significantly lower than the muscle tissue elasticity index.
The clinical aspect of these studies is the examination of the impact of elastography in correctly identifying and influencing the treatment decisions for patients with both primary and secondary hyperparathyroidism.
Elastography adds great value to the preoperative evaluation of patients with both primary or secondary hyperparathyroidism, as it is a simple, operator-independent, repeatable, and reproducible method that can be used complementary to conventional ultrasound. It could also correctly distinguish between thyroid and muscle tissue, when in doubt. It brings important data regarding parathyroid elasticity and it is a convenient and effective tool in the localization and study of hyperparathyroidism.
Conclusions
The aim of this study was to establish the value of elastography in both primary and secondary hyperparathyroidism and to determine whether it can be used to correctly identify parathyroid tissue. By using either the qualitative or the quantitative data of elastography, it brings important information and can better differentiate parathyroid tissue. By using 2D-Shear Wave Elastography, we have found that a value less than 7 kPa is suggestive for parathyroid adenomas and less than 9.98 kPa is suggestive for parathyroid tissue in patients with secondary hyperparathyroidism. Further studies in the field of parathyroid elastography are required in order to establish its value in the localization and treatment of hyperparathyroidism.
Author Contributions
Conceptualization, L.C. and D.S.; methodology, D.S. and I.S.; software, G.N.P.; validation, L.C., D.S. and O.S.; formal analysis, L.C, D.A.; investigation, L.C. and D.S.; resources, O.S and A.S.; data curation A.B., D.A.; writing—original draft preparation, L.C.; writing—review and editing, A.B., S.A.; visualization, L.C.; supervision, D.S.; project administration, D.S.
Funding
This research received no external funding.
Conflicts of Interest
The authors declare no conflict of interest.
Abbreviations
| CKD | Chronic kidney disease |
| EI | Elasticity index |
| ESRD | End-stage renal disease |
| KDIGO | Kidney Disease: Improving Global Outcomes Guidelines |
| PTH | Parathormone |
| Q-box | Quantification box |
| ROI | Region of interest |
| RRT | Renal replacement therapy |
| sHPT | Secondary hyperparathyroidism |
| PHPT | Primary hyperparathyroidism |
| SWE | Shear wave elastography |
| SWE-max | Maximum stiffness value |
| SWE-mean | Mean stiffness value |
| SWE-min | Minimum stiffness value |
References
- Arrangoiz, R.; Cordera, F.; Lambreton, F.; De Leon, E.L.; Moreno, E. Current Thinking on Primary Hyperparathyroidism. JSM Head Neck Cancer Cases Rev. 2016, 1, 1002. [Google Scholar]
- Bilezikian, J.P.; Cusano, N.E.; Khan, A.A.; Liu, J.-M.; Marcocci, C.; Bandeira, F. Primary hyperparathyroidism. Nat. Rev. Dis. Prim. 2016, 2, 16034. [Google Scholar] [CrossRef]
- Hindié, E.; Ugur, Ö.; Fuster, D.; O’Doherty, M.; Grassetto, G.; Ureña, P.; Kettle, A.; Gulec, S.A.; Pons, F.; Rubello, D. 2009 EANM parathyroid guidelines. Eur. J. Nucl. Med. Mol. Imaging 2009, 36, 1201–1216. [Google Scholar] [CrossRef]
- Yuen, N.K. Hyperparathyroidism of Renal Disease. Perm. J. 2016, 20, 15–127. [Google Scholar] [CrossRef]
- Jean, G.; Lafage-Proust, M.H.; Souberbielle, J.C.; Lechevallier, S.; Deleaval, P.; Lorriaux, C.; Hurot, J.M.; Mayor, B.; Mehdi, M.; Chazot, C. Severe secondary hyperparathyroidism in patients on haemodialysis is associated with a high initial serum parathyroid hormone and beta-CrossLaps level: Results from an incident cohort. PLoS ONE 2018, 13, e0199140. [Google Scholar] [CrossRef]
- Palmer, M.; Jakobsson, S.; Åkerström, G.; Ljunghall, S. Prevalence of hypercalcaemia in a health survey: A 14-year follow-up study of serum calcium values. Eur. J. Clin. Investig. 1988, 18, 39–46. [Google Scholar] [CrossRef]
- Abood, A.; Vestergaard, P. Increasing incidence of primary hyperparathyroidism in Denmark. Dan. Med. J. 2013, 60, 4567. [Google Scholar]
- Hedgeman, E.; Lipworth, L.; Lowe, K.; Saran, R.; Do, T.; Fryzek, J. International Burden of Chronic Kidney Disease and Secondary Hyperparathyroidism: A Systematic Review of the Literature and Available Data. Int. J. Nephrol. 2015, 2015, 184321. [Google Scholar] [CrossRef]
- Lorenz, K.; Bartsch, D.K.; Sancho, J.J.; Guigard, S.; Triponez, F. Surgical management of secondary hyperparathyroidism in chronic kidney disease—A consensus report of the European Society of Endocrine Surgeons. Langenbeck’s Arch. Surg. 2015, 400, 907–927. [Google Scholar] [CrossRef]
- Chen, H.; Han, X.; Cui, Y.; Ye, Y.; Purrunsing, Y.; Wang, N. Parathyroid Hormone Fragments: New Targets for the Diagnosis and Treatment of Chronic Kidney Disease-Mineral and Bone Disorder. BioMed Res. Int. 2018, 2018, 9619253. [Google Scholar] [CrossRef]
- Lee, J.H.; Anzai, Y. Imaging of Thyroid and Parathyroid Glands. Semin. Roentgenol. 2013, 48, 87–104. [Google Scholar] [CrossRef]
- Stoian, D.; Bogdan, T.; Craina, M.; Craciunescu, R.T.M.; Schiller, A. Elastography: A New Ultrasound Technique in Nodular Thyroid Pathology. Thyroid Cancer Adv. Diagn. Ther. 2016. [Google Scholar] [CrossRef]
- Dietrich, C.F.; Barr, R.G.; Farrokh, A.; Dighe, M.; Hocke, M.; Jenssesn, C.; Dong, Y.; Saftoiu, A.; Havre, F.R. Strain Elastography—How To Do It ? Ultrasound Int. Open 2017, 3, E137–E149. [Google Scholar] [CrossRef]
- DeWall, R.J. Ultrasound Elastography: Principles, Techniques, and Clinical Applications. Crit. Rev. Biomed. Eng. 2013, 41, 1–19. [Google Scholar] [CrossRef]
- Stoian, D.; Timar, B.; Craina, M.; Bernad, E.; Petre, I.; Craciunescu, M. Qualitative strain elastography—Strain ratio evaluation—An important tool in breast cancer diagnostic. Med. Ultrason. 2016, 18, 195–200. [Google Scholar] [CrossRef]
- Marsaud, A.; Durand, M.; Raffaelli, C.; Carpentier, X.; Rouscoff, Y.; Tibi, B.; Floh, A.; De Villeneuve, M.H.; Haider, R.; Ambrosetti, D.; et al. Elastography shows promise in testicular cancer detection. Prog. Urol. 2015, 25, 75–82. [Google Scholar] [CrossRef]
- Dudea, S.M.; Ciurea, A.; Chiorean, A.; Botar-Jid, C. Doppler applications in testicular and scrotal disease. Med. Ultrason. 2010, 12, 43–51. [Google Scholar]
- Bota, S.; Herkner, H.; Sporea, I.; Salzl, P.; Sirli, R.; Neghina, A.M.; Peck-Radosavljevic, M. Meta-analysis: ARFI elastography versus transient elastography for the evaluation of liver fibrosis. Liver Int. 2013, 33, 1138–1147. [Google Scholar] [CrossRef]
- Azizi, G.; Piper, K.; Keller, J.M.; Mayo, M.L.; Puett, D.; Earp, K.M.; Malchoff, C.D. Shear wave elastography and parathyroid adenoma: A new tool for diagnosing parathyroid adenomas. Eur. J. Radiol. 2016, 85, 1586–1593. [Google Scholar] [CrossRef]
- Hattapoğlu, S.; Göya, C.; Hamidi, C.; Taşdemir, B.; Alan, B.; Durmaz, M.S.; Teke, M.; Ekici, F. Evaluation of Parathyroid Lesions With Point Shear Wave Elastography. J. Ultrasound Med. 2016, 35, 2179–2182. [Google Scholar] [CrossRef]
- Chandramohan, A.; Therese, M.; Abhraham, D.; Paul, T.V.; Mazhuvanchary, P.J. Can ARFI elastography be used to differentiate parathyroid from thyroid lesions? J. Endocrinol. Investig. 2017, 41, 111–119. [Google Scholar] [CrossRef]
- Ruchała, M.; Szczepanek, E. Thyroid ultrasonography—A piece of cake? Endokrynol. Pol. 2010, 61, 330–344. [Google Scholar]
- Polat, A.V.; Ozturk, M.; Akyuz, B.; Çelenk, Ç.; Kefeli, M.; Polat, C. The diagnostic value of shear wave elastography for parathyroid lesions and comparison with cervical lymph nodes. Med. Ultrason. 2017, 19, 386. [Google Scholar] [CrossRef]
- Kunstman, J.W.; Kirsch, J.D.; Mahajan, A.; Udelsman, R. Parathyroid Localization and Implications for Clinical Management. J. Clin. Endocrinol. Metab. 2013, 98, 902–912. [Google Scholar] [CrossRef]
- Parameter, A.P. AIUM Practice Parameter for the Performance of a Thyroid and Parathyroid Ultrasound Examination. J. Ultrasound Med. 2016, 35, 1–11. [Google Scholar]
- Sung, J.Y. Parathyroid ultrasonography: The evolving role of the radiologist. Ultrasonography 2015, 34, 268–274. [Google Scholar] [CrossRef]
- Geatti, O.; Shapiro, B.; Orsolon, P.G.; Proto, G.; Antonucci, F.; Gasparini, D. Localization of parathyroid enlargement: Experience with technetium-99m methoxyisobutylisonitrile and thallium-201 scintigraphy, ultrasonography and computed tomography. Eur. J. Nucl. Med. 1994, 21, 17–22. [Google Scholar] [CrossRef]
- Casara, D.; Rubello, D.; Pelizzo, M.; Shapiro, B. Clinical role of 99mTcO4/MIBI scan, ultrasound and intra-operative gamma probe in the performance of unilateral and minimally invasive surgery in primary hyperparathyroidism. Eur. J. Nucl. Med. 2001, 28, 1351–1359. [Google Scholar] [CrossRef]
- Mariani, G.; A Gulec, S.; Rubello, D.; Boni, G.; Puccini, M.; Pelizzo, M.R.; Manca, G.; Casara, D.; Sotti, G.; Erba, P.; et al. Preoperative localization and radioguided parathyroid surgery. J. Nucl. Med. 2003, 44, 1443–1458. [Google Scholar]
- Kamaya, A.; Quon, A.; Jeffrey, R.B. Sonography of the Abnormal Parathyroid Gland. Ultrasound Q. 2006, 22, 253–262. [Google Scholar] [CrossRef]
- Rickes, S.; Sitzy, J.; Neye, H.; Ocran, K.W.; Wermke, W. High-resolution Ultrasound in Combination with Colour-Doppler Sonography for Preoperative Localization of Parathyroid Adenomas in Patients with Primary Hyperparathyroidism. Ultraschall der Medizin 2003, 24, 85–89. [Google Scholar] [CrossRef]
- Lane, M.J.; Desser, T.S.; Weigel, R.J.; Jeffrey, R.B. Use of color and power Doppler sonography to identify feeding arteries associated with parathyroid adenomas. Am. J. Roentgenol. 1998, 171, 819–823. [Google Scholar] [CrossRef]
- Barr, R.G.; Nakashima, K.; Amy, D.; Cosgrove, D.; Farrokh, A.; Schafer, F.; Bamber, J.; Castera, L.; Choi, B.I.; Chou, Y.-H.; et al. WFUMB Guidelines and Recommendations for Clinical Use of Ultrasound Elastography: Part 2: Breast. Ultrasound Med. Biol. 2015, 41, 1148–1160. [Google Scholar] [CrossRef] [PubMed]
- Cannataro, G.; Mastrodicasa, D.; Cotroneo, A.R.; Caulo, M. Strain Elastosonography of Thyroid Nodules: A New Tool for Malignancy Prediction? Overview of Literature. Endocrinol. Metab. Syndr. 2016, 5, 12–15. [Google Scholar] [CrossRef]
- Yoon, J.H.; Ko, H.; Jung, H.K.; Lee, J.T. Qualitative pattern classification of shear wave elastography forbreast masses: How it correlates to quantitative measurements. Eur. J. Radiol. 2013, 82, 2199–2204. [Google Scholar] [CrossRef]
- Paridah, M.; Moradbak, A.; Mohamed, A.; Abdulwahab, T.; Owolabi, T.; Asniza, M.; Khalid, S.H. We are IntechOpen, the world’ s leading publisher of Open Access books Built by scientists, for scientists TOP 1%. Intech 2016, i, 13. [Google Scholar]
- Sebag, F.; Vaillant-Lombard, J.; Berbis, J.; Griset, V.; Henry, J.-F.; Petit, P.; Oliver, C. Shear Wave Elastography: A New Ultrasound Imaging Mode for the Differential Diagnosis of Benign and Malignant Thyroid Nodules. J. Clin. Endocrinol. Metab. 2010, 95, 5281–5288. [Google Scholar] [CrossRef]
- Cotoi, L.; Stoian, D.; Borlea, A.; Varcus, F. Ultrasonographic and Elastographic Diagnostic of Parathyroid Lesions—A Literature Review. Austin J. Endocrinol. Diabetes 2019, 6, 1068. [Google Scholar]
- Amzar, D.; Borcan, F.; Sporea, I.; Amzar, D.; Schiller, O.; Schiller, A.; Dehelean, C.; Pop, G.N.; Stoian, D. Shear Wave Elastography in Diagnosing Secondary Hyperparathyroidism. Diagnostics 2019, 9, 213. [Google Scholar] [CrossRef]
- Cotoi, L.; Amzar, D.; Sporea, I.; Borlea, A.; Navolan, D.; Varcus, F.; Stoian, D. Shear Wave Elastography versus Strain Elastography in Diagnosing Parathyroid Adenomas. Int. J. Endocrinol. 2020, 2020, 3801902. [Google Scholar] [CrossRef]
- Batur, A.; Atmaca, M.; Yavuz, A.; Ozgokce, M.; Bora, A.; Bulut, M.D.; Arslan, H.; Toktas, O.; Alpaslan, M. Ultrasound Elastography for Distinction Between Parathyroid Adenomas and Thyroid Nodules. J. Ultrasound Med. 2016, 35, 1277–1282. [Google Scholar] [CrossRef]
- Stangierski, A.; Woliński, K.; Ruchala, M. Shear wave elastography in the diagnostics of parathyroid adenomas–new application of the method. Endocrine 2018, 60, 240–245. [Google Scholar] [CrossRef] [PubMed]
- Isidori, A.M.; Cantisani, V.; Giannetta, E.; Diacinti, D.; David, E.; Forte, V.; Elia, D.; De Vito, C.; Sbardella, E.; Gianfrilli, D.; et al. Multiparametric ultrasonography and ultrasound elastography in the differentiation of parathyroid lesions from ectopic thyroid lesions or lymphadenopathies. Endocrine 2016, 57, 335–343. [Google Scholar] [CrossRef] [PubMed]
Figure 1.
(a) Parathyroid adenoma in conventional B mode and Color Doppler. (b) SWE of parathyroid adenoma and qualitative elastogram.
Figure 1.
(a) Parathyroid adenoma in conventional B mode and Color Doppler. (b) SWE of parathyroid adenoma and qualitative elastogram.
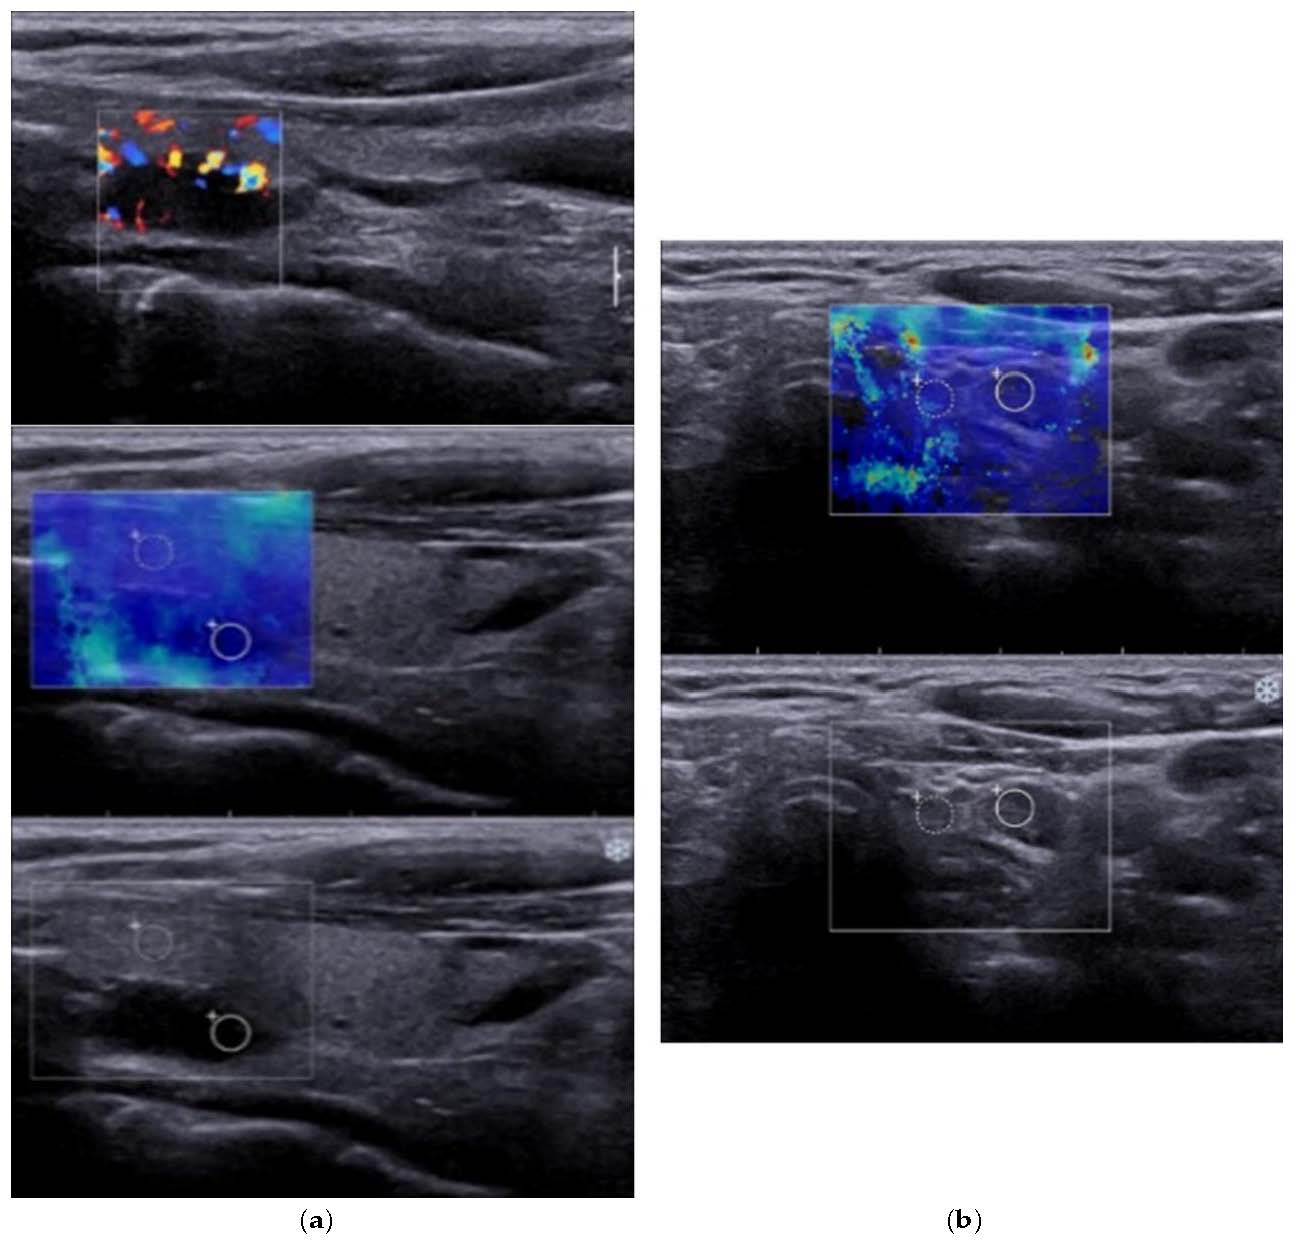
Figure 2.
(a) 2B-Mode ultrasound evaluation of parathyroid hyperplasia, with an image of parathyroid hyperplasia in Color Doppler Mode; (b) Elastogram overlying B mode image of parathyroid hyperplasia, with a color map of tissue elasticity.
Figure 2.
(a) 2B-Mode ultrasound evaluation of parathyroid hyperplasia, with an image of parathyroid hyperplasia in Color Doppler Mode; (b) Elastogram overlying B mode image of parathyroid hyperplasia, with a color map of tissue elasticity.
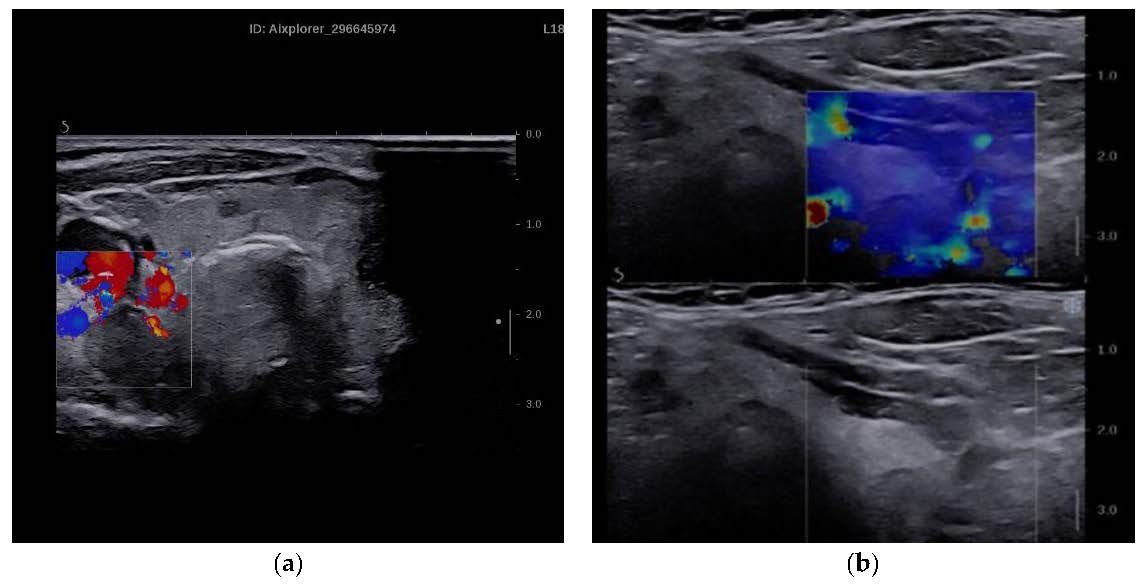
Figure 3.
Comparison of mean SWE between parathyroid adenomas, thyroid, and muscle.
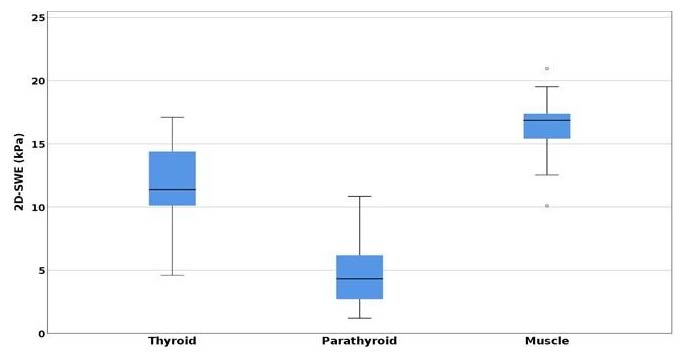
Figure 4.
Statistical difference between mean SWE of parathyroid, thyroid and muscle.
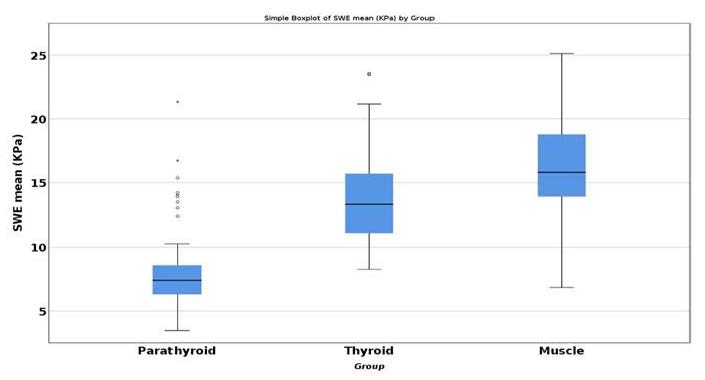
Figure 5.
Area under the curve (AUC) for SWE mean parathyroid/muscle
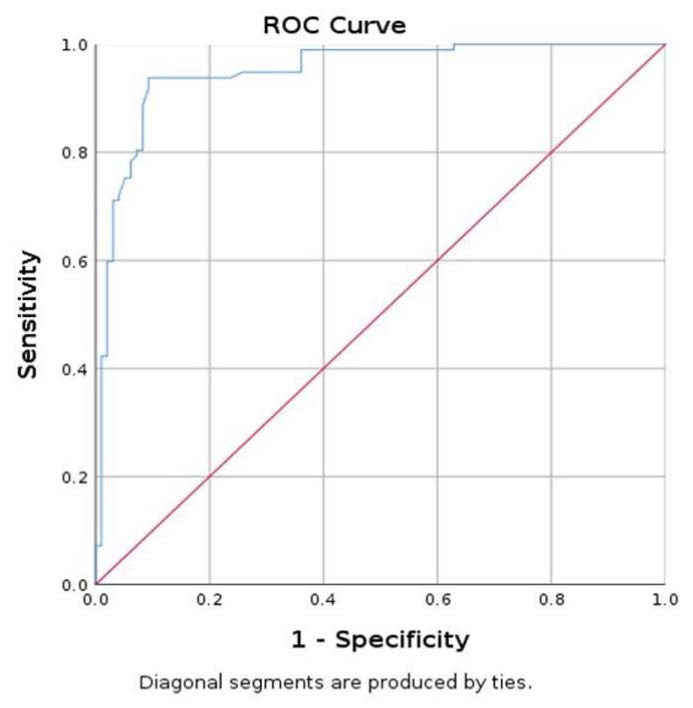
Figure 6.
Area under the curve (AUC) for prediction of parathyroid using SWE mean.
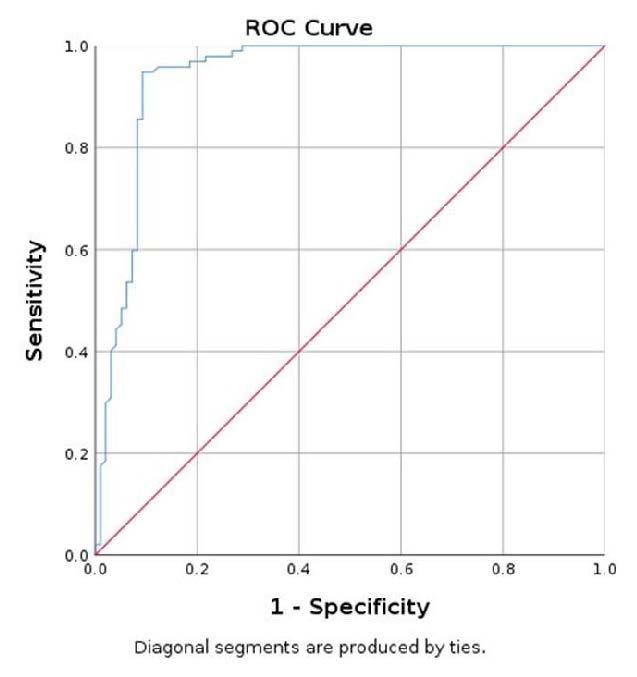
Figure 7.
Elastography evaluation algorithm.
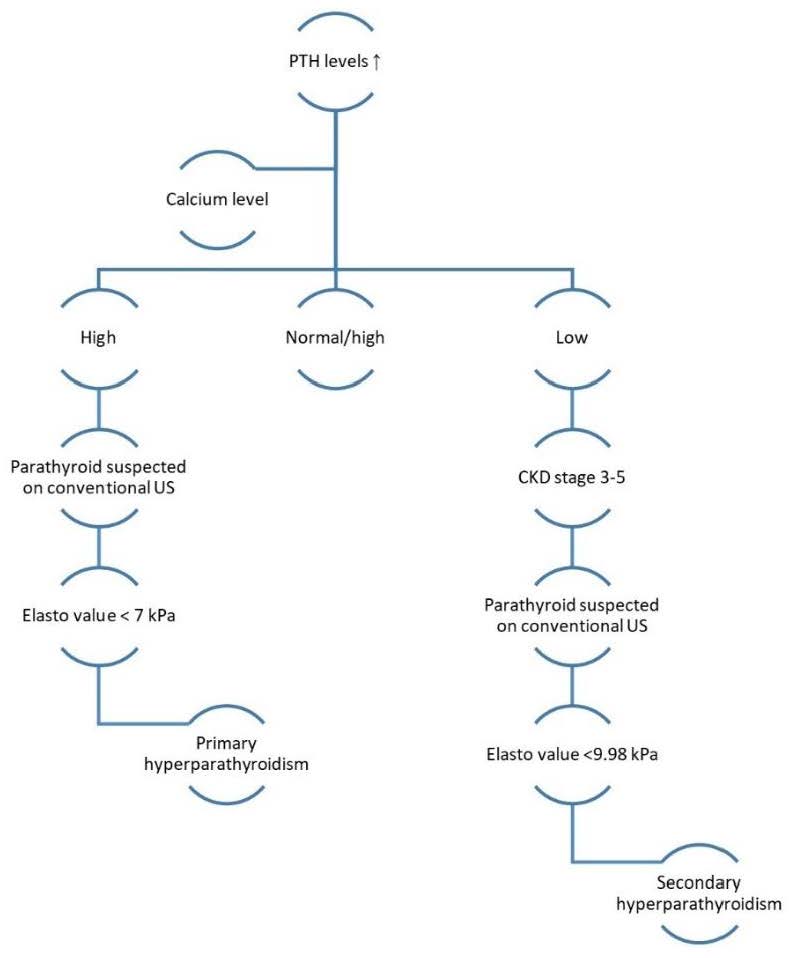

Table 1.
Baseline characteristics of the lots studied (20 cases with primary hyperparathyroidism, 59 cases with secondary hyperparathyroidism).
Table 1.
Baseline characteristics of the lots studied (20 cases with primary hyperparathyroidism, 59 cases with secondary hyperparathyroidism).
| Characteristics | Primary Hyperparathyroidism Group | Secondary Hyperparathyroidism Group |
|---|---|---|
| F/M | 19/1 | 27/32 |
| Age (years) | 57.3 ± 13.33 | 56.95 ± 10.92 |
| Total number of parathyroid glands | 20 | 97 |
| Parathyroid volume (mL) | 0.21 ± 0.32 | 0.21 ± 0.26 |
| Parathormone (pg/mL) | 153.29 ± 118.43 | 1161.86 ± 797.66 |
| Total serum calcium (mg/dL) | 10.5 ± 0.96 | 8.73 ± 0.76 |
| 25-OH Vitamin D (ng/mL) | 23.07 ± 8.77 | 33.57 ± 13.30 |
| Kt/v ratio | / | 1.363 ± 0.123 |
| Dialysis years | / | 5.94 ± 4.49 |
Table 2.
2D-SWE results: mean value ± standard deviation (SD), minimum value ± SD, maximum value ± SD. SWE—shear wave elastography.
Table 2.
2D-SWE results: mean value ± standard deviation (SD), minimum value ± SD, maximum value ± SD. SWE—shear wave elastography.
| Mean SWE (kPa) | Min SWE (kPa) | Max SWE (kPa) | |
|---|---|---|---|
| Parathyroid adenoma (first lot) | 4.74 ± 2.745 | 1 ± 0.434 | 11 ± 6.266 |
| Thyroid tissue (first lot) | 11.718 ± 4.206 | 7.013 ± 4.532 | 18.133 ± 7.789 |
| Muscle tissue (first lot) | 16.362 ± 3.829 | 11.412 ± 4.097 | 25.518 ± 7.933 |
| Parathyroid hyperplasia (second lot) | 7.835 ± 2.944 | 4.630 ± 2.272 | 12.956 ± 6.126 |
| Thyroid tissue (second lot) | 13.780 ± 4.039 | 9.438 ± 3.606 | 20.349 ± 7.509 |
| Muscle tissue (second lot) | 15.788 ± 4.409 | 13.851 ± 4.024 | 23.181 ± 10.493 |
Table 3.
Sensitivity, specificity, accuracy and cut-off values for measured SWE-min, SWE-max, and SWE-mean for parathyroid adenomas.
Table 3.
Sensitivity, specificity, accuracy and cut-off values for measured SWE-min, SWE-max, and SWE-mean for parathyroid adenomas.
| SWE-Min PTX/T | SWE-Mean PTX/T | SWE-Max PTX/T | SWE-Min PTX/M | SWE-Mean PTX/M | SWE-Max PTX/M | |
|---|---|---|---|---|---|---|
| Area under curve (AUC) value | 0.957 | 0.950 | 0.765 | 0.998 | 0.997 | 0.955 |
| Specificity | 85% | 90.0% | 70.0% | 95.0% | 95.0% | 80.0% |
| Sensitivity | 95% | 95.0% | 80.0% | 100% | 100% | 100% |
| PPV | 86.4% | 90.5% | 72.7% | 95.2% | 95.2% | 83.3% |
| NPV | 94.4% | 94.7% | 77.8% | 100% | 100% | 100% |
| Accuracy | 90.0% | 92.5% | 75.0% | 97.5% | 97.5% | 90.0% |
| p value | <0.001 | <0.001 | <0.001 | <0.001 | <0.001 | <0.001 |
| Cut-off value | <3.14 kPa | <7.28 kPa | <9.14 kPa | <5.32 kPa | <10.47 kPa | <15.16 kPa |
© 2020 Copyright by the authors. Licensed as an open access article using a CC BY 4.0 license