
Timisoara_Med 2021, 2020(2), 10; doi:10.35995/tmj20200210
Article
Analysis of the Variability of the Pharmacokinetics of the Long Half-Life Drug Amiodarone in Bioequivalence Studies
1
Faculty of Pharmacy, “Carol Davila” University of Medicine and Pharmacy, 020021 Bucharest, Romania; razaqmaitham@yahoo.com (M.R.S.); vali_anuta@yahoo.com (V.A.)
2
Faculty of Pharmacy, “Titu Maiorescu” University, 040441 Bucharest, Romania; ion.mircioiu@prof.utm.ro (I.M.); Roxana.sandulovici@prof.utm.ro (R.S.)
*
Correspondence: constantin.mircioiu@yahoo.com; Tel.: +40-0723-175-022
How to cite: Shleghm, M.R.; Mircioiu, I.; Anuta, V.; Mircioiu, C.; Sandulovici, R. Analysis of the Variability of the Pharmacokinetics of the Long Half-Life Drug Amiodarone in Bioequivalence Studies. Timisoara Med. 2020, 2020(2), 10; doi:10.35995/tmj20200210.
Received: 5 February 2021 / Accepted: 4 March 2021 / Published: 8 March 2021
Abstract
:The article provides an extensive analysis of the data obtained in bioequivalence studies, which can be considered for further evaluation in the development of general and individual therapeutic regimens. Concrete data obtained in two bioequivalence studies compared amiodarone formulations and included plasma levels of amiodarone and the active metabolite desethylamiodarone. The analysis included mean data and variability in plasma concentrations and pharmacokinetic parameters. In addition, a global and structural meta-analysis of the individual plasma level sets was performed. The half-life of amiodarone was not well defined and the total area below the plasma level curves was less appropriate for estimating bioequivalence.
Keywords:
variabilities; meta-analysis; individual profiles; global structural analysisIntroduction
Following oral administration to humans, amiodarone (AMD) is absorbed slowly and variably. The bioavailability of AMD is approximately 50% [1]. After a single dose, peak plasma concentrations are reached in 3 to 7 h. The relationships between plasma concentrations and the pharmacodynamic effect are very complex. It can appear in 2 to 3 days, but more often lasts one to three weeks, and even longer after dosing. AMD has a very large and variable volume of distribution, averaging about 60 L/kg due to its extensive accumulation in various compartments, especially adipose tissue and highly perfused organs [2]. A major metabolite of AMD, desethylamiodarone (dAMD), has been identified in humans. The main route of elimination is by hepatic excretion into the bile and significant enterohepatic circulation may occur.
In patients, AMD has been shown to have a biphasic elimination [3,4]. For dAMD, the mean half-life is 61 days. These data probably reflect an initial elimination of the drug from well-perfused tissues (half-life phase of 2.5 to 10 days) followed by a second phase with much slower elimination mainly from the fats.
The objectives of the studies were to compare the rate and degree of absorption, areas under the curves and variabilities for AMD administered in bioequivalence (BE) studies performed in the laboratory of the authors over the years.
Materials and Methods
Clinical Studies’ Design
The studies were single-dose, randomized, blinded, cross-over, two-treatment, two-period and two-sequence studies, comparing equal doses (3 × 200 mg) of generic formulations with the reference drug CORDARONE tablets (Sanofi). A total of 24 healthy volunteers were included. Half of the volunteers first received the reference product, and, after a three-week wash, the drug was tested. The other volunteers received the drugs in reverse order. The volunteers were randomly distributed in the two sequences. They remained at the clinical site for at least ten hours before and after administration of the drug. Standard meals were provided four and ten hours after the drug was administered.
The study protocols were approved by the National Medicines Agency and the institutional ethics committee. Subjects signed an informed consent before being included in the studies.
Sampling and Processing of Blood Samples
Venous blood samples were collected pre-dose (0 h) and at 1, 2, 3, 4, 4.5, 5, 5.5, 6, 6.5, 7, 7.5, 8, 9, 10, 12, 24, 48, 72, 96, 120 and 144 h after administration by direct venous puncture or by a catheter inserted into an antecubital vein. Blood samples were immediately centrifuged and plasma samples were frozen at −30 °C. The treatment of plasma involved the addition of an internal standard (fenofibrate), followed by liquid/liquid extraction of the analytes from plasma into methylene chloride.
Analytical Method
The analytical method was fully validated in terms of adequate sensitivity, specificity, linearity, recovery, accuracy and precision (both within and between the different runs). AMD and dAMD concentrations were analyzed.
Pharmacokinetic Analysis
Individual plasma concentrations were further used to calculate the pharmacokinetic parameters: maximum concentration (Cmax), time of maximum concentration (Tmax), area under plasma levels in the T time interval after administration (AUC0–T), total area (AUC0–∞) and half-life (t1/2). To calculate the last two parameters, it was necessary to estimate the slope of the linear regression approximating the logarithm of concentrations in the terminal elimination, which in estimation, in the case of long half-life drugs and especially in the case of amiodarone, is not a well-defined problem and many difficulties may arise, which are discussed further in this paper. For the estimation of bioequivalence, the ratios of maximum concentrations, of AUC0–T and of AUC0–∞ were calculated.
Statistical Analysis
The mathematical model [5], accepted by researchers and the FDA [6], in the analysis of data in cross-over, two-period and two-sequence experiments was
where µ = the total mean; i = index for subject; j = index for period; k = index for sequence; F(j,k) = the direct fixed effect of the formulation in the kth sequence which is administered at the jth period; C(j−1,k) = the fixed first-order carry-over effect of the formulation in the kth sequence and (j − 1)th period; eijk = the (within-subject) random error in observing Yijk. Sik is the random variable corresponding to subject i in sequence k. In the case of amiodarone, due to enterohepatic circulation, it is difficult to say if the maximum concentrations could be considered as normally distributed. Interindividual variability was assessed using coefficients of variation for pharmacokinetic parameters.
Yijk = µ + Sik + Pj + F(j,k) + C(j−1,k) + eijk
Results
Usual assessment of bioequivalence is performed in terms of mean plasma levels and pharmacokinetic parameters. As can be seen in Figure 1 (common representation in bioequivalence studies), mean plasma levels and mean maximum concentrations of the compared formulations were very close to each other. It should be noted that what is usually the maximum concentration, in the case of amiodarone, is a fluctuation, a “zone of maximum concentrations”, which is, as a rule, the consequence of the characteristic metabolic reactions of lipophilic drugs that lead to enterohepatic circulation, with a perturbation effect on the estimation of bioequivalence and with clinical implications [7,8,9,10,11,12].
However, beyond this first appearance, we must look for variability because it is very important for a particular patient if they are in the upper or lower part of the plasma level group, as the therapeutic and toxic effects are dependent on drug concentrations. Therefore, it is necessary to know well the main aspects of the variability in determining the benefit/risk ratio of the drug.
In the second stage, a characterization of the variability is added, using the standard deviations of the populations of concentrations corresponding to the different time points, as can be seen in Figure 2.
Global, Structural Evaluation of Plasma Level Curves
The variability between subjects, suggested by standard deviations, is huge for both the parent drug and the metabolite. This is perhaps the most significant aspect of the risk of side effects. What is not highlighted by such a representation, otherwise common in works other than those related to bioequivalence, are some very significant phenomena that can influence the conclusions of statistical evaluations: the presence of outliers and/or data partitioning in some different clusters, different absorption delays, etc. [11,13]. These characteristics can be observed after examining the set of all individual curves, which, unfortunately, is a type of representation missing in the works related to bioequivalence studies.
In BE studies, the following may appear as outliers: points, a set of points in the zone of maximum concentrations, entire pharmacokinetic curves, pairs of curves corresponding to the same subject, subjects, pharmacokinetic ratios, etc. [14]. The outliers in pharmacokinetic parameters that influence the decision in BE are those for which their ratios corresponding to a given subject are outliers compared to the confidence intervals for those parameters. These pharmacokinetic outliers may have bioanalytical, physiological and physicochemical causes.
Examination of Figure 3 shows immense variability in Cmax, Tmax and AUC in the case of the metabolite. Examination of whole curves (from 0 to 120 h) suggests a possible partitioning of curves into two groups: one with lower levels of concentration and a group of curves with high values. On the other hand, the highest concentration curve seems to be an outlier curve.
Statistical Evaluation of Variability of Pharmacokinetic Parameters
Variability of Pharmacokinetic Parameters
The main pharmacokinetic parameters of the reference and tested drugs as well as the 90% confidence interval are presented in Table 1.
Maximum AMD concentrations. The variability between subjects, measured by the coefficient of variation (CV), was practically the same, 48% for the drug tested and 54% for the reference drug. A high amplitude of variability was observed, in the range 136–1082 ng /mL for the tested drug and 168–1190 ng/mL for the reference drug. It is not possible to determine the intrasubject variability in a BE study in the absence of replicate drug administration, but since the products were bioequivalent and the ANOVA calculation revealed the absence of statistically significant sequence and period effects, it is possible to approximate it with the measured period difference (which includes intravariability, formulation effects and period effects). The estimated intravariability in this way is actually pooled between that of the reference drug and the drug being tested.
Maximum metabolite concentrations. Partitioning into two clusters was even more evident in the case of the metabolite. There were distinct classes, but there was also a significant gap between them:
- -
- Concentrations lower than 50 ng/mL;
- -
- Some (5 out of 24 curves) concentrations higher than 125 ng/mL.
Variability of AUC0–T. The variability was high in the case of AMD (CV = 46%) and very high in the case of the metabolite (125%), with insignificant differences between the reference and tested formulations. The range of values was huge: 4000–24,000 ng/mL*h for AMD and 200–8000 for dAMD.
AUC0–∞ variability. The variability was even higher than that of AUC0–T.
Discussion
The variability of pharmacokinetics is an essential feature of the interaction between the drug and the living body, the rate and extent of release into the gastrointestinal tract, absorption, distribution, metabolism and excretion, ultimately determining the magnitude and rates of the therapeutic response and the balance between the efficacy and safety of an orally administered drug. In-depth evaluation of the PK/PD complex correlations involves a huge amount of research to overcome a great amount of difficulties. Under these conditions, the in-depth analysis of the results of bioequivalence studies, beyond comparing the bioavailability of two formulations, is not only an opportunity but also a moral duty. Last but not least, clinical trials are becoming more expensive and more and more complex, and regulatory restrictions are becoming more and more burning. Basic clinical research traditionally conducted by universities has been drastically reduced.
In BE studies, plasma concentrations are usually monitored at 15 to 30 time points, over two or more periods, usually on 24 subjects, representing a total of thousands of individual data. Factors that can be evaluated by chemical, mathematical and statistical methods are the pharmacokinetic parameters as well as their range of values and inter- and intrasubject variability.
In the case of the AMD lipophilic drug with a long half-life, there are particular difficulties in defining the maximum concentrations, but also the half-life and the elimination period. For the calculation of the total area, extrapolated from the area from zero to the last measuring point T, the formula shall apply:
so that the definition includes three relatively independent parameters, AUC0–T , C(T), and .
In bioequivalence studies we are practically looking for the effects of the formulation and, in this context, we are less concerned about the elimination period. However, in the calculation of the total area under curve, we use t1/2, whose uncertainty and variability are a real problem in the case of long half-life drugs. As a result of this variability, the confidence intervals for the mean ratio of AUC0–∞ for the test and reference drugs are longer than the confidence intervals for the AUC0–T ratio.
An FDA recommendation published in 2010 states: “For drugs that demonstrate low intrasubject variability in distribution and clearance, an AUC truncated at 72 h (AUC0–72h) can be used in place of AUC0–T or AUC0–∞” [4]. However, the data collected and removed from the BE estimate remain very useful in research on the development of general or individual schemes of AMD therapy. Many unexplained facts remain in this regard, but a meta-analysis that includes a few more BE studies could lead to a partial understanding of the mechanisms of changes presented above.
Conclusions
- The pharmacokinetics of AMD is very complex and highly variable, involving challenges in developing general therapeutic and individual treatment regimens.
- Thousands of data obtained from bioequivalence studies can and should be evaluated in subsequent pharmacodynamic and therapeutic studies.
- In addition to the usual average results and standard deviations, it is useful to estimate value ranges, outlier values and data clustering.
Author Contributions
Conceptualization, M.R.S. and C.M.; methodology, I.M., V.A. and R.S.; software, I.M. and R.S.; writing—original draft preparation, M.R.S. and C.M.; writing—review and editing, M.R.S. and C.M.; supervision, C.M. and R.S.
Funding
The authors declare no funding.
Conflicts of Interest
The authors declare no conflict of interest.
References
- Holt, D.W.; Tucker, G.T.; Jackson, P.R.; Storey, G.C. Amiodarone pharmacokinetics. Am. Heart J. 1983, 106, 840–847. [Google Scholar] [CrossRef]
- Djiane, P.; Marchiset, D.; Bory, M.; Baille, Y.; Serradimigni, A.; Cano, J. Myocardial and plasma drug levels of amiodarone and its desethyl metabolite. Eur. Heart J. 1984, 5, 112. [Google Scholar]
- Freedman, M.D.; Somberg, J.C. Pharmacology and Pharmacokinetics of Amiodarone. J. Clin. Pharmacol. 1991, 31, 1061–1069. [Google Scholar] [CrossRef] [PubMed]
- FDA. 2010. Available online: https://www.accessdata.fda.gov/drugsatfda_docs/psg/Amiodarone_HCl_tab_ 18972_RC12-10.pdf (accessed on 23 January 2021).
- Schuirmann, D.J. A comparison of the two one-sided tests procedure and the power approach for assessing the bioequivalence of average bioavailability. J. Pharmacokinet. Biopharm. 1987, 15, 657–680. [Google Scholar] [CrossRef] [PubMed]
- FDA Guidance for Industry—Statistical Approaches to Establishing Bioequivalence. 2001. Available online: https://www.fda.gov/downloads/drugs/guidances/ucm070244.pdf.
- Dedík, L.; Mircioiu, C.; Tvrdoňová, M.; Miklovičová, D.; Ďurišová, M. Physiologically-motivated Time-delay Model to Account for Probable Mechanisms Underlying Enterohepatic Recirculation of Piroxicam in Humans. Basic Clin. Pharmacol. Toxicol. 2008. [Google Scholar]
- Tvrdonova, M.; Chrenova, J.; Rausova, Z.; Miklovicova, D.; Durisova, M.; Mircioiu, C.; Dedik, L. Novel approach to bioequivalence assessment based on physiologically motivated model. Int. J. Pharm. 2009, 380, 89–95. [Google Scholar] [CrossRef] [PubMed]
- Tvrdonova, M.; Dedik, L.; Mircioiu, C.; Miklovicova, D.; Durisova, M. Physiologically Motivated Time-Delay Model to Account for Mechanisms Underlying Enterohepatic Circulation of Piroxicam in Human Beings. Basic Clin. Pharmacol. Toxicol. 2009, 104, 35–42. [Google Scholar] [CrossRef] [PubMed]
- Chrenova, J.; Durisova, M.; Mircioiu, C.; Dedik, L. Effect of Gastric Emptying and Entero-Hepatic Circulation on Bioequivalence Assessment of Ranitidine. Methods Find. Exp. Clin. Pharmacol. 2010, 32, 413–419. [Google Scholar] [CrossRef] [PubMed]
- Sandulovici, R.; Vatasescu, A.; Enache, F.; Mircioiu, C. Failure of Statistical Methods to Prove Bioequivalence of Two Meloxicam Bioequivalent Formulations. II. Non-Parametric Methods. Farmacia 2011, 59, 367–380. [Google Scholar]
- Roberts, M.S.; Magnusson, B.M.; Bruczynski, F.J.; Weiss, M. Enterohepatic circulation: Physiological, pharmacokinetic and clinical implications. Clin. Pharmacokinet. 2002, 41, 751–790. [Google Scholar] [CrossRef] [PubMed]
- Vatasescu, A.; Enache, F.; Mircioiu, C.; Miron, D.; Sandulovici, R. Failure of statistical methods to prove bioequivalence of meloxicam drug products. I. parametric methods. Farmacia 2011, 59, 161–169. [Google Scholar]
- Sandulovici, R.; Mircioiu, I.; Aboul-Enein, H.Y.; Manolache, M.; Mircioiu, C.; Voicu, V.; Anuta, V. Sources of outlier data in the bioanalytical and clinical part of a piroxicam bioequivalence study. Int. J. Clin. Pharmacol. Ther. 2020, 58, 652–663. [Google Scholar] [CrossRef] [PubMed]
Figure 1.
Concentrations of AMD and dAMD in the time interval 0–72 h.
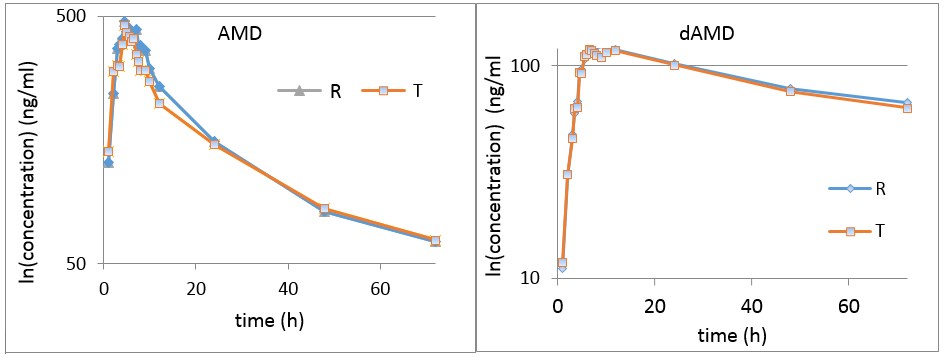
Figure 2.
Plasma concentrations of AMD and dAMD.
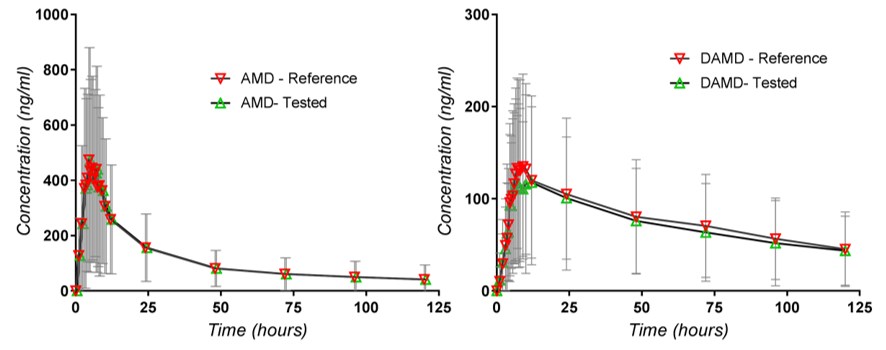
Figure 3.
Individual plasma levels of dAMD concentrations


Table 1.
Pharmacokinetic parameters of the reference and tested drugs.
| Pharmacokinetic Parameters | Amiodarone (Tested) | Cordarone (Reference) | 90% Confidence Interval |
| Cmax (ng/mL) | 537.18 ± 25.81 | 585.75 ± 315.12 | 84–104 |
| Tmax (hours) | 6.56 ± 1.58 | 6.00 ± 1.887 | |
| T1/2 (hours) | 31.47 ± 10.53 | 33.60 ± 11.63 | |
| AUC0–120 h (ng*mL−1*hour) | 10,228 ± 4734.6 | 789 ± 4472.47 | 93–106 |
| AUC0–∞ (ng*mL−1*hour) | 11,351.0 ± 5488.65 | 11,341.9 ± 5261.23 | 92–108 |
| CMAX/AUC | 0.0479 ± 0.0151 | 0.0512 ± 0.0173 | 85–104 |
| N-desethyl-Amiodarone (Tested) | N-desethyl-Amiodarone (Reference) | 90% Confidence Interval | |
| Cmax (ng/mL) | 56.49 ± 62.52 | 52.26 ± 61.04 | 93–118 |
| Tmax (hours) | 6.08 ± 2.80 | 8.21 ± 8.78 | |
| T1/2 (hours) | 69.42 ± 33.36 | 71.53 ± 26.56 | |
| AUC0–120 h (ng*mL−1*hour) | 1586.49 ± 1984.63 | 1693.83 ± 2207.81 | 87–105 |
| AUC0–∞ (ng*mL−1*hour) | 2341.61 ± 2794.36 | 2655.63 ± 3410.883 | 87–108 |
| CMAX/AUC | 0.0273 ± 0.0261 | 0.0265 ± 0.0262 | 93–125 |
© 2021 Copyright by the authors. Licensed as an open access article using a CC BY 4.0 license.