
Timisoara_Med 2020, 2020(1), 3; doi:10.35995/tmj20200103
Case Report
COVID-19—Clinical Relevance of a Negative RT-PCR SARS-CoV-2 Test
1
Department of Pulmonology, “Dr. Victor Babeș” Clinical Hospital, 300310 Timișoara, România; roxana.jurca@yahoo.com (R.J.); tudorache_emanuela@yahoo.com (E.T.); oancea@umft.ro (C.O.)
2
Department of Pulmonology, Victor Babeș University of Medicine and Pharmacy, 300310 Timișoara, România; dr.diana.manolescu@gmail.com
3
Department of Radiology, “Dr. Victor Babeș” Clinical Hospital, 300310 Timișoara, România
*
Correspondence: m.camil26@yahoo.com; Tel.: +40-742550365
How to cite: Jurca, R.; Mihuța, C.; Tudorache, E.; Manolescu, D.; Oancea, C. COVID-19—Clinical Relevance of a Negative RT-PCR SARS-CoV-2 Test. Timisoara Med. 2020, 2020(1), 3; doi:10.35995/tmj20200103.
Received: 15 September 2020 / Accepted: 14 October 2020 / Published: 21 October 2020
Abstract
:(1) Background: In the current clinical practice of the COVID-19 infection, the focus should not be placed on the positive RT-PCR results, but rather on the epidemiological, clinical, and imaging aspects specific to the disease. (2) Case Report: We present the case of a 34-year-old female, who had contacts with both her parents, both of whom were confirmed to have SARS-CoV-2 infection by RT-PCR testing. She presented for about one week symptoms suggestive of COVID-19 infection, determining her to repeatedly go to the emergency room, where she had three negative SARS-CoV-2 RT-PCR tests. The blood tests revealed leukopenia with lymphocytopenia, with increased lactate dehydrogenase (LDH) and C-reactive protein (CRP). Moreover, the chest X-ray showed modifications specific for COVID-19, and the diagnosis of COVID-19 was set. Drug treatment with hydroxychloroquine, azithromycin, cephalosporins, systemic corticosteroids, anticoagulants, bronchodilators, and interleukin-6 inhibitors was initiated, together with oxygen therapy. (3) Discussion: SARS-CoV-2 RT-PCR testing may give false negative results due to inadequate biological sampling, or to the accuracy of the test methods. A significant contribution to the diagnosis is made by the specific computed tomography (CT) criteria of COVID-19. (4) Conclusions: A priority for COVID-19 diagnosis accuracy is epidemiological investigation, together with clinical criteria and CT imaging, even in the presence of a negative RT-PCR test.
Keywords:
COVID-19; SARS-CoV-2; negative RT-PCR; clinical characteristics; pneumonia; tomography; X-ray computed; case reportIntroduction
COVID-19 is an infectious disease caused by the SARS-CoV-2 virus, a strain of coronavirus, one of the 40 subspecies of coronavirus, of which only seven are pathogenic to humans [1]. The virus is capable of causing severe acute respiratory syndrome (SARS). In Wuhan, China, the first outbreak of COVID-19 pneumonia appeared in December 2019, then spread very quickly and reached pandemic level with more than 25 million confirmed cases (over 850,000 deaths) by August 30, 2020 [2]. In the absence of a specific antiviral treatment or vaccine, infection prevention and control measures are the only temporary solutions that can minimize the risk of disease [3]. In the diagnosis of COVID-19, reverse transcription polymerase chain reaction (RT-PCR) testing is fundamental. However, in a significant proportion of patients, the test is negative. The rate of false negative results varies between 30–50% of real cases infected with COVID-19.
Case Report
We present the case of a 34-year-old non-smoker female—who had contacts with both her parents, both of whom were confirmed to have SARS-CoV-2 infection by RT-PCR testing—with hypertensive disease, which was treated with beta blockers and angiotensin-converting enzyme (ACE) inhibitors. The patient had presented with a diffuse headache, 38 °C fever, dry cough, dyspnea at low effort (mMRC Dyspnea Scale = 2) and fatigue for about a week, determining her to repeatedly visit the emergency services of the Hunedoara County Hospital, where she was finally hospitalized, along with her father, who was also infected with SARS-CoV-2. After 5 days, she was transferred to the Department of Pulmonology at “Dr. Victor Babes” Hospital in Timișoara, Romania, where she was hospitalized for further investigation and treatment. The chest X-ray revealed inhomogeneous opacification, imprecisely delimited on the right side, and micronodular opacities; on the left side, opaque band lesions appeared. Blood tests showed leukopenia with lymphocytopenia and elevated levels of LDH and CPR. Although the patient had three negative PCR-SARS-CoV-2 tests (on 07/11 and 07/12 in Hunedoara County Hospital and then in our clinic on 07/16), she was still considered infected with COVID-19, based on the epidemiological element, the suggestive symptomatology and the radiological lesions compatible with a COVID-19 infection. The patient was treated with hydroxychloroquine, azithromycin, cephalosporin, systemic corticosteroids, anticoagulants, bronchodilators, anti-interleukin-6 and oxygen therapy.
Personal pathological history: Essential hypertension and class 1 obesity (Body Mass Index (BMI) = 30.42 kg/m2).
Family history: Contact with her father (confirmed SARS-CoV-2 positive by RT-PCR), approximately 2 to 4 days prior to the onset of our patient’s symptoms. The patient’s mother was also confirmed SARS-CoV-2 positive, but she was isolating at home, being less symptomatic. All three family members participated in a meeting in a closed space, with about 100 people, 7 days before the symptomatic onset of the father. Subsequently, another 15 people who attended that meeting were identified as positive.
Biological tests performed during hospitalization are shown in Table 1.
After 10 days of treatment, we detected a lymphocyte number increase, while C-reactive protein (CRP) and lactate dehydrogenase (LDH) levels decreased. An increase in the number of leukocytes can also be attributed to corticosteroid therapy, as well as platelet count. Bacterial infection was excluded due to normal serum procalcitonin. A normal concentration of D-dimers eliminated the existence of a fluid–coagulant imbalance. Normal concentrations of transaminases, bilirubin and serum creatinine removed the possibility of extension to other organs. The ECG was normal: sinus rhythm, intermediate QRS axis, HR = 70 rpm, without acute ischemic changes.
In the first day of hospitalization in our clinic, a native chest CT was performed and both lung fields presented trabecular peribronchovascular condensations (in the anterior upper right lobe segment and in basal segments in lower lobes) (Figure 1). A ground-glass component was associated with central peribronchovascular distribution, which accompanied the trabecular areas described above, with an extension <20%. On the 14th day of treatment, the CT scan was repeated. There was a significant improvement compared to the first scan. Bilateral lung lesions could no longer be observed, with the exception of a 6-mm node in the right middle lobe, probably of fibrous nature (Figure 2).
In our clinic, treatment with hydroxychloroquine was ceased, but the treatment with antiretrovirals (Darunavirum 800 mg/day and Ritonavirum 100 mg/day), macrolides (Azithromycinum 500 mg 1cp/day), systemic corticosteroids (Dexamethasonum 8 mg, 2 x1/day), Nadroparinum 1 mL every 24 h, ACE inhibitors (Perindoprilum 5 mg/day) and a β blocker (Nebivololum 5 mg/day) continued. The patient was discharged after 15 days of treatment in our clinic. The acute viral infection had a 28–30-day evolution from the onset of the symptoms until a favorable evolution appeared. Symptomatic treatment was recommended as needed, including isolation for another 14 days and a repeat of the RT-PCR-SARS-2 testing.
Diagnosis at discharge: COVID-19 bronchopneumonia—moderate form, remitted under treatment, negative RT-PCR, essential hypertension, obesity grade I.
Discussion
The diagnosis of COVID-19 is based on three criteria, which, in order of relevance, are: (a) recent history of a contact with a person proven to be infected with COVID-19, (b) a positive RT-PCR-SARS-CoV-2 test associated or not with (c) an imaging aspect highly suggestive of COVID-19. The symptoms can be extremely polymorphic, but, in general, they are symptoms of viral impregnation [4].
The diagnosis of our case was based on the presence of epidemiological and imaging criteria, with repeated RT-PCR testing being negative three times, against the backdrop of moderate viral impregnation. Reasons for false negative results include: (a) the low accuracy of the collection of biological samples, (b) the performance of the test method, (c) the timing of the disease at the time of collection, (d) the degree of viral load at various anatomical sites, and others (for example, various viral RNA sequences). Regarding the degree of viral load in upper respiratory samples, detection by RT-PCR reaches a maximum between days 3–9 and disappears or attenuates massively (in cases with favorable evolution) between days 18–21 from the onset of symptoms [5,6,7]. Therefore, premature collection as well as collection too late can lead to false negative results. It is highly likely that, in this case, it was a combination of (a) with (b) and (c). The literature records the sensitivity rate of the method as 45–60%, making re-testing mandatory in symptomatic patients with a negative result [8].
Ignoring these criteria will lead to diagnosis failure, no initiation of isolation/treatment measures and, as a direct consequence, to uninterrupted contagion [7]. In these situations, which are not rare, a diagnostic decision will be made on the notion of contact with a person proven to be infected or where there is a high suspicion of them having COVID-19, combined with the contribution of suggestive imaging. To increase the detection rate of a possible infection, an early warning score is described in the literature.
The incubation period of the virus is 2–14 days (median 5–6 days), and the interval from the onset of symptoms to hospitalization varies between 2 and 7 days. The complete clinical picture is not yet clear, as the symptoms reported thus far differ ranging from asymptomatic patients to extreme cases resulting in death. In terms of frequency, there are common symptoms (fever (85–90%), cough (65–70%), fatigue (35–40%), expectoration (30–35%), and dyspnea (15–20%)), uncommon symptoms (myalgias/arthralgias, headache, angina pharyngeal, chills, pleural pain, anosmia, and ageusia), and rare symptoms (nausea, vomiting, diarrhea, nasal congestion, chest tightness, palpitations, hemoptysis, convulsions, and paresthesia). The symptoms are grouped into six clusters: cluster 1 (“flu” impregnation without fever), cluster 2 (“flu” impregnation with fever), cluster 3 (gastrointestinal picture), cluster 4 (severity level I—increased fatigue), cluster 5 (severity level II—confusion), cluster 6 (severity level III—abdominal and respiratory) [9]. Patients who fall into cluster 5 or 6 on day 5 of the disease have a significant risk of hospitalization and respiratory support: 9.9% and 19.9%, respectively. Our patient fit into cluster 2, with favorable evolution consistent with the classification.
Comorbidities have a significant role, influencing the receptivity to the infection and the evolution/prognosis of the disease. An age over 65 years, cardiovascular disease (hypertension, heart failure), chronic obstructive pulmonary disease (COPD) GOLD III-IV, diabetes, obesity, and advanced immunosuppressive conditions are important risk factors [10]. The patient had two of these listed factors: hypertension and obesity. Hypertension is not only incriminated due to hemodynamic changes, but also due to the medication used: angiotensin-converting enzyme inhibitors, especially angiotensin 2 cellular receptor inhibitors (ACE-2, e.g., sartans). Sartans, located on the surface of the cells of the bronchial epithelium, are considered to be receptors for coronavirus and would represent the respiratory gateway of the virus [11].
In a retrospective analysis of 3615 patients with COVID-19, it was observed that patients less than 60 years old and with a BMI ≥35 kg/m2 were 3.6 times more likely to be admitted to the ICU than patients with a BMI <25 kg/m2. In another retrospective study of 124 patients, the need for mechanical ventilation was 7.36 times higher for patients with a BMI> 35 kg/m2, compared to patients with a BMI <25 kg/m2 (p = 0.02) [12]. Our patient used ACE inhibitors (Perindoprilum) but was 34 years old and only had class 1 obesity (BMI = 30.2 kg/m2).
Several laboratory parameters predict a higher risk of mortality. High leukocytosis, lymphocytopenia, neutropenia and blood urea were observed more frequently in deceased patients than in survivors in the second and third weeks of illness. Lymphocytopenia (˂10%) is a strong independent risk factor for unfavorable prognosis. Concentrations of procalcitonin (deceased vs. recovered (0.33 vs. 0.5)), hsCRP (113.0 vs. 26.2), ferritin (1418.3 vs. 481.2), and ESR (38.5 vs. 28) were significantly higher in deceased patients than in recovered patients (p <0.05). Interleukin(IL)-2, IL-6, IL-8 and IL-10 receptors and tumor necrosis factor alpha (TNFα) concentrations were also significantly higher in deceased patients than in recovered patients. Of these, maximum IL-6 levels, followed by CRP levels, are highly predictive of the need for mechanical ventilation. Non-specific increases in cardiac troponin and NT-Pro BNP may occur due to coronavirus-induced cardiac injury. A value of D-dimers higher than 2.0 µg/mL at hospitalization would predict hospital mortality with a sensitivity of 92.3% and specificity of 83.3% [13].
The analysis of the lab values from Table 1 shows slight to moderate changes, without signs of extrapulmonary touch, changes that normalized after 10–14 days of treatment. Seroconversion (immunoglobulin M (IgM), immunoglobulin G (IgG)) occurs at the earliest 6–12 days after the onset of symptoms. In the case of favorable evolution, IgM level increases during the first week after onset, reaching a maximum around day 14, to decrease/disappear around day 21. IgG serum is detectable after 1 week following SARS-CoV-2 infection and it reaches a maximum after 28–30 days. IgG serum then remains at a plateau for at least 3–6 months. However, the persistence of IgM over the described interval is a sign of the biological activity of the disease, a situation encountered in cases with severe evolution, culminating eventually in death. A lack of an IgG response is also a bad predictor, as post-infectious immunity is not established [14,15]. As such, there is a chance of being re-infected during a future encounter with this virus. IgM and IgG serological detection is helpful in diagnosing suspected patients with negative RT-PCR, but also in identifying asymptomatic infections. However, we have to keep in mind that cross-reactions with other beta-coronaviruses may occur in Ig determinations [14,15].
RT-PCR allows the use of ribonucleic acid (RNA) as a template. Additionally, it allows for the detection and amplification of RNA. Most commonly, it is used as a first step in qPCR, which quantifies RNA transcription in a biological sample [16].
Detection of the virus by RT-PCR and IgM/IgG serology in COVID-19 infection can provide us with various associations [8], situations whose interpretations are presented in Table 2.
The use of CT imaging should take into account the following:
- Initial CT is negative in 18–50% of COVID-19 cases, which is why CT should not be used as a screening method;
- CT may predict an unfavorable evolution (need for mechanical ventilation), or exclude other complications (pulmonary embolism, pulmonary edema, superinfections);
Four evolutionary stages in CT are described: the incipient/initial stage (0–4 days), the progressive stage (5–8 days), the peak stage (9–13 days) and the resorption stage (>14 days). The evolution of radiological images detected by repeated scans shows that, in about 90% of cases, there is an improvement in lung damage, while 9–10% of cases have a stable condition or imaging damage [17,18]. The imaging behavior of the analyzed patient places them in the 90% group, with quasi-total regression. In various studies, a higher sensitivity of CT was observed of approximately 97% compared to RT-PCR testing, whose sensitivity varies between 45–60%.
To be considered cured, after the diagnosis of COVID-19 has been confirmed, a patient must have two negative PCR-SARS-CoV-2 tests and obviously an improvement in clinical and biological scores. Cases have been described in which, even after two consecutive negative tests, a few days after retesting, the result was positive [19]. In order to avoid such a situation, in which the rate of transmission of the infection would inevitably be higher, it was recommended that patients considered cured continue to isolate for another 14 days and get re-tested [20]. On the other hand, the Korean Center for Disease Control and Prevention published a report stating that, of 790 people who came into contact with about 285 coronavirus patients who were “re-infected” with SARS-CoV2, none was infected with the virus. The “re-positive” patients did not spread any persistent infection, and the virus samples collected from them could not be multiplied in culture, which means that the patients had non-infectious or dead virus particles. RT-PCR tests for coronavirus nucleic acid cannot tell the difference between particles containing dead virus and those with viable virus. This suggests that the patients were not re-infected, but rather that they had dead virus particles [21]. Therefore, dead virus fragments can remain (for how long?) in the body of a recovered patient.
In the case described, once the clinical picture, biological parameters and imaging improved substantially, the patient was discharged, with recommended home isolation for 14 days and subsequent RT-PCR re-testing.
Conclusions
In the diagnosis of infection, RT-PCR-SARS-CoV-2 testing may be false negative. The history of the disease and the epidemiological contact associated with compatible lung imaging has a decisive weight. Biological data in the clinical context reinforced the reality of infection and showed the non-installation of specific protective immunity, alerting us to a possible subsequent reinfection. The high blood pressure and obesity of the patient may have played a role in the current evolution and are especially likely to in the future.
Author Contributions
R.J. designed the report and conducted the research, collected the patient’s clinical data and wrote the original draft; C.M. was part of the investigation process and led the analysis of the collected clinical data; C.O. provided therapeutic resources and verified the results, reviewed and edited the final draft and provided supervision of the research activity and mentorship for the core team; D.M. collected and interpreted the radiological data; E.T. wrote part of the initial draft, managed and coordinated the research activity and provided the validation of the final results. All authors have read and approved the manuscript.
Funding
There was no external source of funding.
Acknowledgments
We acknowledge the Pulmonology Department of our Hospital for their assistance.
Conflicts of Interest
The authors declare no conflicts of interest.
Abbreviations
| ACE | Angiotensin converting enzyme |
| SARS | Severe acute respiratory syndrome |
| COV 2 | Coronavirus |
| CT | Computed tomography |
| LDH | Lactate dehydrogenase |
| PCR | Polymerase chain reaction |
| CRP | C-reactive protein |
| ASAT | Aspartate aminotransferase |
| ALAT | Alanine aminotransferase |
| IgM | Immunoglobulin M |
| IgG | Immunoglobulin G |
| HR | Heart rate |
| BMI | Body Mass Index |
| IL | Interleukin |
| COPD | Chronic obstructive pulmonary disease |
| ESR | Erythrocyte sedimentation rate |
| mMRC | Modified Medical Research Council |
| RNA | Ribonucleic acid |
References
- International Committee on Taxonomy of Viruses. Naming the Coronavirus Disease (COVID-19) and the Virus That Causes It. Available online: https://talk.ictvonline.org (accessed on 20 September 2020).
- European Centre for Disease Prevention and Control, Communicable disease threats report. Available online: https://www.ecdc.europa.eu/en/publications-data/communicable-disease-threats-report-30-august-5-sep-2020-week-36 (accessed on 2 September 2020).
- Sanders, J.M.; Monogue, M.L.; Jodlowski, T.Z.; Cutrell, J.B. Pharmacologic Treatments for Coronavirus Disease 2019 (COVID-19): A Review. JAMA 2020, 323, 1824–1836. [Google Scholar] [CrossRef] [PubMed]
- Richardson, S.; Hirsch, J.S.; Narasimhan, M.; Crawford, J.M.; McGinn, T.; Davidson, K.W.; Barnaby, D.P.; Becker, L.B.; Chelico, J.D.; Cohen, S.L.; et al. Presenting Characteristics, Comorbidities, and Outcomes Among 5700 Patients Hospitalized With COVID-19 in the NewYork City Area. JAMA 2020, 323, 2052–2059. [Google Scholar] [CrossRef] [PubMed]
- Zou, L.; Ruan, F.; Huang, M.; Liang, L.; Huang, H.; Hong, Z.; Yu, J.; Kang, M.; Song, Y.; Xia, J.; Guo, Q. SARS-CoV-2 Viral Load in Upper Respiratory Specimens of Infected Patients. N. Engl. J. Med. 2020, 382, 1177–1179. [Google Scholar] [CrossRef] [PubMed]
- To, K.K.W.; Tsang, O.T.Y.; Leung, W.S.; Tam, A.R.; Wu, T.C.; Lung, D.C.; Yip, C.C.Y.; Cai, J.P.; Chan, J.M.C.; Chik, T.S.H.; et al. Temporal profiles of viral load in posterior oropharyngeal saliva samples and serum antibody responses during infection by SARS-CoV-2: An observational cohort study. Lancet Infect. Dis. 2020, 20, 565–574. [Google Scholar] [CrossRef]
- Leung, N.H.; Chu, D.K.; Shiu, E.Y.; Chan, K.H.; McDevitt, J.J.; Hau, B.J.; Yen, H.L.; Li, Y.; Ip, D.K.; Peiris, J.M.; Seto, W.H. Respiratory virus shedding in exhaled breath and efficacy of face mask. Nat. Med. 2020, 26, 676–680. [Google Scholar] [CrossRef] [PubMed]
- Covid-19 Webinars Respiratory. COVID-19 in Chronic Respiratory Diseases. Available online: https://touchtoconnect.se/public/bi_utbildningar/covid_19_webinars_respiratory/ (accessed on 20 September 2020).
- Sudre, C.H.; Lee, K.; Lochlainn, M.N.; Varsavsky, T.; Murray, B.; Graham, M.S.; Menni, C.; Modat, M.; Bowyer, R.C.; Nguyen, L.H.; et al. Symptom clusters in Covid19: A potential clinical prediction tool from the COVID Symptom study app. medRxiv 2020. [Google Scholar] [CrossRef]
- Zhou, F.; Yu, T.; Du, R.; Fan, G.; Liu, Y.; Liu, Z.; Xiang, J.; Wang, Y.; Song, B.; Gu, X.; et al. Clinical course and risk factors for mortality of adult inpatients with COVID-19 in Wuhan, China: A retrospective cohort study. Lancet 2020, 6737, 1054–1062. [Google Scholar] [CrossRef]
- Kevin, J.; Clerkin, J.; Jayant, R.; Gabriel, S. Coronavirus Disease 2019 (COVID-19) and Cardiovascular Disease. Circulation 2020, 141, 1648–1655. [Google Scholar]
- Aakriti, G.; Mahesh, V.M.; Kartik, S.; Nandini, N. Extrapulmonary manifestations of COVID-19. Nat. Med. 2020, 26, 1017–1032. [Google Scholar]
- Marco, C.; Michael, R.; Arturo, C.; Scott, C.D. Evaluation and Treatment Coronavirus (COVID-19); Stat Pearls: Treasure Island, FL, USA, 2020. [Google Scholar]
- Long, Q.-X.; Liu, B.-Z.; Deng, H.-J.; Wu, G.-C.; Deng, K.; Chen, Y.-K.; Liao, P.; Qiu, J.-F.; Lin, Y.; Cai, X.-F.; et al. Antibody responses to SARS-CoV-2 in patients with COVID-19. Nat. Med. 2020, 26, 845–848. [Google Scholar] [CrossRef] [PubMed]
- Hou, H.; Wang, T.; Zhang, B.; Luo, Y.; Mao, L.; Wang, F.; Hou, H.; Sun, Z. Detection of IgM and IgG antibodies in patients with coronavirus disease 2019. Clin. Transl. Immunol. 2020, 9, e01136. [Google Scholar] [CrossRef] [PubMed]
- What Are the Differences between PCR, RT-PCR, qPCR, and RT-qPCR? Available online: https://www.enzolifesciences.com/science-center/technotes/2017/march/what-are-the-differences-between-pcr-rt-pcr-qpcr-and-rt-qpcr? (accessed on 24 September 2020).
- COVID-19, Radiopaedia. Available online: https://radiopaedia.org/articles/covid-19-4 (accessed on 24 September 2020).
- Fighting COVID-19. Webinar COVID-19 in Chronic Respiratory Diseases. Available online: https://www.123sonography.com/covid-19 (accessed on 23 September 2020).
- Li, R.; Pei, S.; Chen, B.; Song, Y.; Zhang, T.; Yang, W.; Shaman, J. Substantial undocumented infection facilitates the rapid dissemination of novel coronavirus (SARS-CoV2). Science 2020, 368, 489–493. [Google Scholar] [CrossRef] [PubMed]
- Pang, J.; Wang, M.X.; Ang, I.Y.H.; Tan, S.H.X.; Lewis, R.F.; Chen, J.I.-P.; A Gutierrez, R.; Gwee, S.X.W.; Chua, P.E.Y.; Yang, Q.; et al. Potential Rapid Diagnostics, Vaccine and Therapeutics for 2019 Novel Coronavirus (2019-nCoV): A Systematic Review. J. Clin. Med. 2020, 9, 623. [Google Scholar] [CrossRef] [PubMed]
- COVID Patients Testing Positive after Recovery Aren’t Infectious. Available online: https://www.bloomberg.com/news/articles/2020-05-19/covid-patients-testing-positive-after-recovery-aren-t-infectious (accessed on 23 August 2020).
Figure 1.
Thoracic CT performed in the first day of hospitalization.
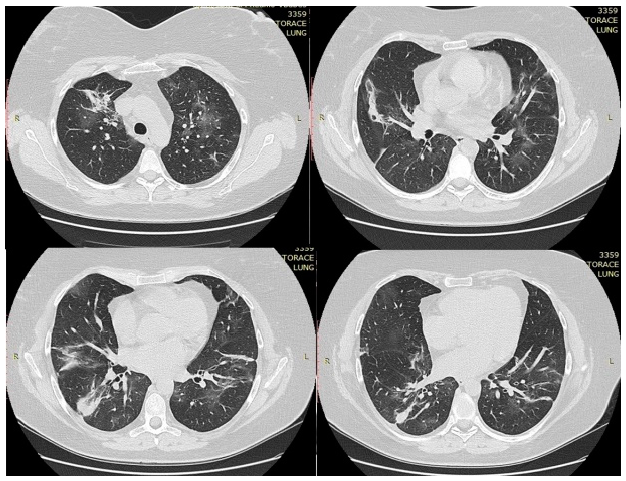
Figure 2.
Thoracic computed tomography (CT) performed after 14 days of treatment.
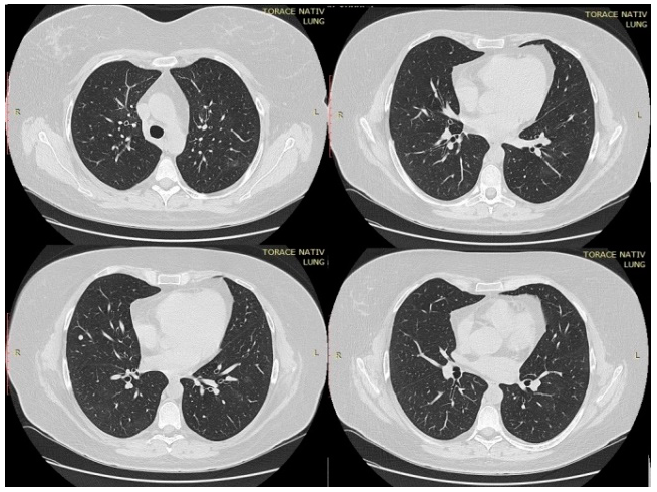

Table 1.
Biological parameters.
| Parameters | Tests Performed in 1st Hospital (07/11/2020) | Tests #1 Performed in Our Clinic (07/16/2020) | Tests #2 Performed in Our Clinic (07/24/2020) |
|---|---|---|---|
| Leukocytes number (u/L) | 5.48 × 10³ u/L | 6.81 × 10³ u/L | 14.3 × 10³ u/L |
| Lymphocytes number (u/L) | 0.77 × 10³ u/L | 0.98 × 10³ u/L | 0.78 × 10³ u/L |
| Platelets number (u/L) | 183 × 103 u/L | 419 × 103 u/L | 475 × 103 u/L |
| Fibrinogen (g/L) | - | - | 2.70 g/L |
| CRP (mg/L) | 6.36 mg/L | 3.79 mg/L | 0.21 mg/L |
| LDH (U/L) | 302.2 U/L | 205 U/L | - |
| D-dimers (mcg/mL) | - | 0.7 mcg/mL | - |
| Procalcitonin (ng/mL) | - | 0.03 ng/mL | - |
| TGO (U/L) | - | 89.7 U/L | 30 U/L |
| TGP (U/L) | - | 198.2 U/L | 152.6 U/L |
| Serum creatinine (mg/dL) | - | 0.49 mg/dL | 0.55 mg/dL |
| Serum IgM | + (qualitative determination) | 15.59 au/mL | |
| Serum IgG | - (qualitative determination) | 4.95 au/mL | |
| SaO2 (%) in atmospheric air | 92–94% | 96–97% | 97–98% |
Table 2.
RT-qPCR results, IgM and IgG serology reflected in clinical significance.
| Test Results | Clinical Significance | ||
|---|---|---|---|
| RT-qPCR | IgM | IgG | |
| + | - | - | Patient may be in the window period of infection. |
| + | + | - | Patient may be in the early stage of infection. |
| + | + | + | Patients are the active phases of infection. |
| + | - | + | Patient may be in the late or recurrent stage of infection. |
| - | + | - | Patient may be in the early stage of infection. RT-qPCR result may be false-negative. |
| - | - | + | Patient may have had past infection and has recovered. |
| - | + | + | Patient may be in the recovery stage of an infection/RT-qPCR result may be false-negative. |
© 2020 Copyright by the authors. Licensed as an open access article using a CC BY 4.0 license.